
House Prices in Stubbington
House prices in Stubbington have an overall average of £414,696 over the last year.
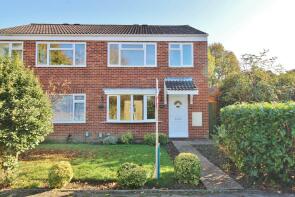
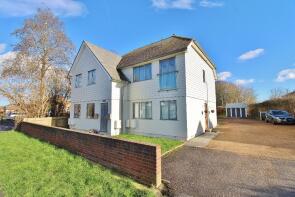
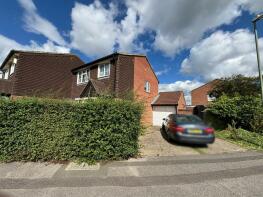
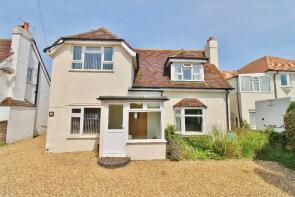
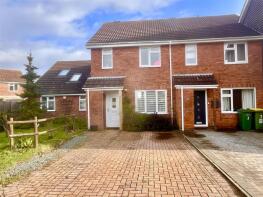
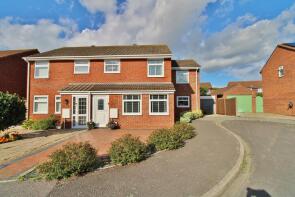
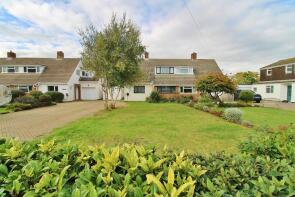
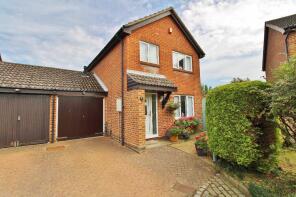
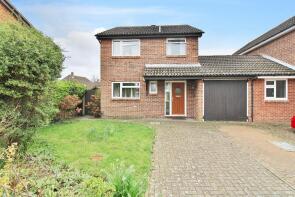
The majority of properties sold in Stubbington during the last year were semi-detached properties, selling for an average price of £362,953. Detached properties sold for an average of £555,783, with terraced properties fetching £328,927.
Overall, the historical sold prices in Stubbington over the last year were 13% down on the previous year and 5% down on the 2022 peak of £434,654.
Properties Sold
44, Cutlers Lane, Fareham PO14 2JW
| Today | See what it's worth now |
| 24 Jun 2025 | £380,000 |
| 24 Jul 1995 | £76,000 |
No other historical records.
34, Fitzwilliam Avenue, Fareham PO14 3SD
| Today | See what it's worth now |
| 17 Jun 2025 | £462,000 |
| 29 Sep 2021 | £407,000 |
No other historical records.
3, Cremyll Close, Fareham PO14 2PU
| Today | See what it's worth now |
| 12 Jun 2025 | £340,000 |
| 20 Oct 2006 | £237,000 |
11, Forth Close, Fareham PO14 3SZ
| Today | See what it's worth now |
| 11 Jun 2025 | £185,000 |
| 26 Oct 2012 | £115,500 |
30, Eric Road, Fareham PO14 2RN
| Today | See what it's worth now |
| 10 Jun 2025 | £415,000 |
| 13 Dec 2016 | £287,500 |
No other historical records.
31, Elsfred Road, Fareham PO14 3NJ
| Today | See what it's worth now |
| 30 May 2025 | £260,000 |
No other historical records.
15, East House Avenue, Fareham PO14 2RE
| Today | See what it's worth now |
| 27 May 2025 | £349,995 |
| 16 Aug 1999 | £97,000 |
No other historical records.
17, Jay Close, Fareham PO14 3TA

| Today | See what it's worth now |
| 23 May 2025 | £525,000 |
| 12 Aug 1998 | £142,250 |
No other historical records.
10, Hawk Close, Fareham PO14 3SW
| Today | See what it's worth now |
| 23 May 2025 | £253,000 |
| 17 Jul 2009 | £78,532 |
No other historical records.
19, Sea Kings, Fareham PO14 3SX
| Today | See what it's worth now |
| 23 May 2025 | £310,000 |
| 26 Aug 2011 | £183,000 |
9d, Burnt House Lane, Fareham PO14 2LF
| Today | See what it's worth now |
| 23 May 2025 | £196,000 |
| 24 Nov 2023 | £185,500 |
14, Victory Road, Fareham PO14 2SE
| Today | See what it's worth now |
| 22 May 2025 | £328,000 |
| 4 Jun 2014 | £220,000 |
6, Hill Head Road, Fareham PO14 3JH
| Today | See what it's worth now |
| 16 May 2025 | £767,500 |
| 29 Apr 2005 | £425,000 |
6, Fernie Close, Fareham PO14 3SQ
| Today | See what it's worth now |
| 16 May 2025 | £335,000 |
| 27 Aug 2015 | £202,000 |
14, Finisterre Close, Fareham PO14 3TB


| Today | See what it's worth now |
| 16 May 2025 | £266,000 |
| 23 Aug 2004 | £220,500 |
14, Dover Close, Fareham PO14 3SU
| Today | See what it's worth now |
| 16 May 2025 | £420,000 |
| 16 Sep 2015 | £289,950 |
55, Solent Road, Fareham PO14 3LB
| Today | See what it's worth now |
| 16 May 2025 | £575,000 |
| 14 Mar 2019 | £346,000 |
No other historical records.
12, Swordfish Close, Lee-on-the-solent PO13 9FJ
| Today | See what it's worth now |
| 12 May 2025 | £875,000 |
| 25 Aug 2005 | £495,000 |
No other historical records.
31, Oakdown Road, Fareham PO14 2QR
| Today | See what it's worth now |
| 28 Apr 2025 | £585,000 |
| 22 Nov 2023 | £310,000 |
No other historical records.
5, Amberley Court, Fareham PO14 2BF
| Today | See what it's worth now |
| 11 Apr 2025 | £415,000 |
| 19 Sep 2017 | £380,000 |
62, Cuckoo Lane, Fareham PO14 3PE
| Today | See what it's worth now |
| 4 Apr 2025 | £365,000 |
| 22 Aug 2016 | £275,000 |
22 The Retreat, Anker Lane, Fareham PO14 3HF
| Today | See what it's worth now |
| 28 Mar 2025 | £680,000 |
| 3 Nov 2017 | £532,500 |
No other historical records.
34, Puffin Crescent, Fareham PO14 3LG
| Today | See what it's worth now |
| 28 Mar 2025 | £388,000 |
| 7 Aug 2006 | £198,000 |
No other historical records.
32, Puffin Crescent, Fareham PO14 3LG
| Today | See what it's worth now |
| 28 Mar 2025 | £355,000 |
| 18 May 2006 | £224,995 |
No other historical records.
29, East House Avenue, Fareham PO14 2RE
| Today | See what it's worth now |
| 28 Mar 2025 | £369,995 |
No other historical records.
Get ready with a Mortgage in Principle
- Personalised result in just 20 minutes
- Find out how much you can borrow
- Get viewings faster with agents
- No impact on your credit score
What's your property worth?
Source Acknowledgement: © Crown copyright. England and Wales house price data is publicly available information produced by the HM Land Registry.This material was last updated on 6 August 2025. It covers the period from 1 January 1995 to 30 June 2025 and contains property transactions which have been registered during that period. Contains HM Land Registry data © Crown copyright and database right 2025. This data is licensed under the Open Government Licence v3.0.
Disclaimer: Rightmove.co.uk provides this HM Land Registry data "as is". The burden for fitness of the data relies completely with the user and is provided for informational purposes only. No warranty, express or implied, is given relating to the accuracy of content of the HM Land Registry data and Rightmove does not accept any liability for error or omission. If you have found an error with the data or need further information please contact HM Land Registry.
Permitted Use: Viewers of this Information are granted permission to access this Crown copyright material and to download it onto electronic, magnetic, optical or similar storage media provided that such activities are for private research, study or in-house use only. Any other use of the material requires the formal written permission of Land Registry which can be requested from us, and is subject to an additional licence and associated charge.
Map data ©OpenStreetMap contributors.
Rightmove takes no liability for your use of, or reliance on, Rightmove's Instant Valuation due to the limitations of our tracking tool listed here. Use of this tool is taken entirely at your own risk. All rights reserved.