
House Prices in TA19
House prices in TA19 have an overall average of £351,940 over the last year.
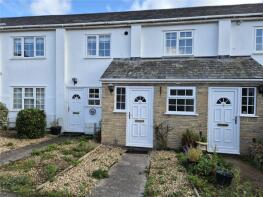
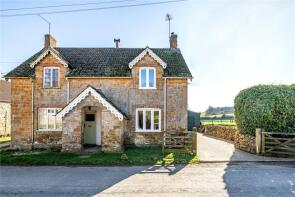
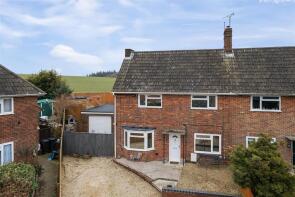
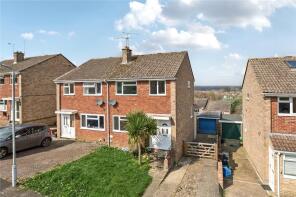
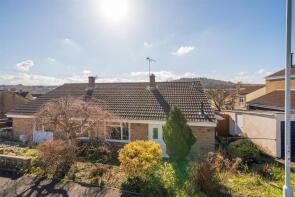
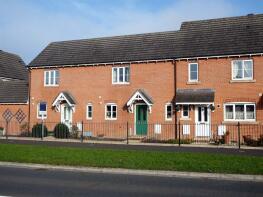
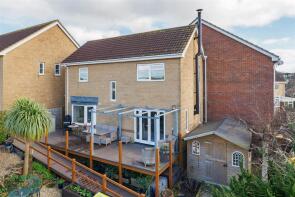
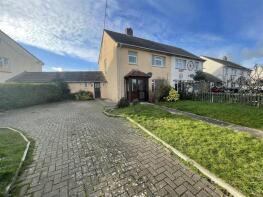
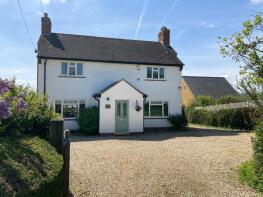
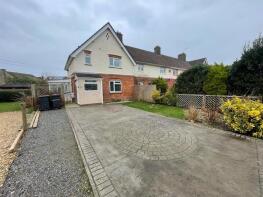
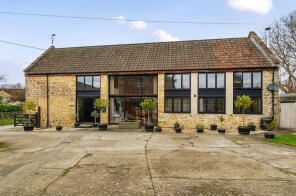
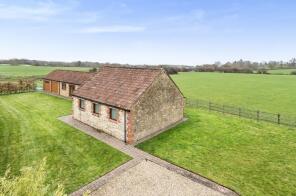
The majority of properties sold in TA19 during the last year were detached properties, selling for an average price of £467,661. Terraced properties sold for an average of £267,744, with semi-detached properties fetching £294,812.
Overall, the historical sold prices in TA19 over the last year were 5% up on the previous year and similar to the 2021 peak of £348,614.
Properties Sold
3, Westerly Court, Court Barton, Ilminster TA19 9SP
| Today | See what it's worth now |
| 10 Jun 2025 | £165,000 |
| 9 Jun 2021 | £172,000 |
1, Manor Cottages, Water Street, Seavington St Mary, Ilminster TA19 0QR
| Today | See what it's worth now |
| 6 Jun 2025 | £335,000 |
| 18 Jun 2021 | £315,000 |
8, Station Road, Ilminster TA19 9BD


| Today | See what it's worth now |
| 6 Jun 2025 | £285,000 |
| 6 Jul 2015 | £183,500 |

71, Blackdown View, Ilminster TA19 0BD
| Today | See what it's worth now |
| 3 Jun 2025 | £300,000 |
| 1 Feb 2019 | £200,000 |
46, Herne Rise, Ilminster TA19 0HJ
| Today | See what it's worth now |
| 30 May 2025 | £250,000 |
No other historical records.
35, Copse Lane, Ilton, Ilminster TA19 9HG
| Today | See what it's worth now |
| 30 May 2025 | £237,000 |
| 28 Jul 2023 | £225,000 |
Hillcrest, Puckington Road, Puckington, Ilminster TA19 9JA
| Today | See what it's worth now |
| 28 May 2025 | £565,000 |
| 28 Apr 2022 | £580,000 |
16, The Crescent, Ilminster TA19 0ER
| Today | See what it's worth now |
| 27 May 2025 | £295,000 |
| 23 Mar 2012 | £160,000 |
No other historical records.
Flintstones, Pottery Road, Horton, Ilminster TA19 9QW
| Today | See what it's worth now |
| 27 May 2025 | £425,000 |
| 29 Nov 2018 | £355,000 |
No other historical records.
6, Summerlands Park Avenue, Ilminster TA19 9BS
| Today | See what it's worth now |
| 27 May 2025 | £300,000 |
| 20 Dec 2017 | £185,000 |
25, Canal Way, Ilminster TA19 9DS
| Today | See what it's worth now |
| 23 May 2025 | £185,000 |
| 3 Jul 2015 | £153,000 |
11, Eames Orchard, Ilminster TA19 0BZ
| Today | See what it's worth now |
| 20 May 2025 | £325,000 |
| 25 Feb 2021 | £233,000 |
7, Cottage Corner, Main Street, Ilton, Ilminster TA19 9EP
| Today | See what it's worth now |
| 16 May 2025 | £200,000 |
| 27 Jun 1996 | £45,250 |
No other historical records.
School House, Church Square, Ilton, Ilminster TA19 9EX
| Today | See what it's worth now |
| 16 May 2025 | £382,000 |
| 29 Aug 2014 | £295,000 |
5, Thornleigh View, Horton, Ilminster TA19 9FP
| Today | See what it's worth now |
| 14 May 2025 | �£525,000 |
| 5 Feb 2019 | £435,000 |
No other historical records.
1, Lower Meadow, Ilminster TA19 9DR
| Today | See what it's worth now |
| 9 May 2025 | £222,500 |
| 27 Feb 2004 | £133,020 |
No other historical records.
Minster Cottage, Wharf Lane, Ilminster TA19 0DT
| Today | See what it's worth now |
| 2 May 2025 | £215,000 |
| 7 Dec 2022 | £240,000 |
Hartland House, Hare Lane, Broadway, Ilminster TA19 9LN
| Today | See what it's worth now |
| 17 Apr 2025 | £595,000 |
| 10 Jul 2014 | £425,000 |
7, The Crescent, Ilminster TA19 0ER
| Today | See what it's worth now |
| 14 Apr 2025 | £285,000 |
No other historical records.
Washcross Barn, Littlefields Lane, Shepton Beauchamp, Ilminster TA19 0LA
| Today | See what it's worth now |
| 11 Apr 2025 | £675,000 |
| 21 Oct 2011 | £398,000 |
Bumble Barn, Winterhay Lane, Ilminster TA19 9PJ
| Today | See what it's worth now |
| 31 Mar 2025 | £420,000 |
| 30 Sep 2003 | £155,000 |
No other historical records.
Hideaway Cottage, Main Street, Whitelackington, Ilminster TA19 9EF
| Today | See what it's worth now |
| 31 Mar 2025 | £610,000 |
| 26 Mar 2004 | £130,000 |
2, Harvey Way, Ashill, Ilminster TA19 9QD
| Today | See what it's worth now |
| 28 Mar 2025 | £237,000 |
| 23 Jul 2010 | £149,950 |
3, Sharlands, Barrington, Ilminster TA19 0JF
| Today | See what it's worth now |
| 28 Mar 2025 | £310,000 |
| 5 Mar 2021 | £260,000 |
No other historical records.
70, East Street, Ilminster TA19 0AW

| Today | See what it's worth now |
| 28 Mar 2025 | £235,000 |
| 24 Apr 2023 | £207,500 |
Find out how much your property is worth
The following agents can provide you with a free, no-obligation valuation. Simply select the ones you'd like to hear from.
Sponsored
All featured agents have paid a fee to promote their valuation expertise.

Symonds & Sampson
Ilminster

Mayfair Town & Country
Crewkerne
Get ready with a Mortgage in Principle
- Personalised result in just 20 minutes
- Find out how much you can borrow
- Get viewings faster with agents
- No impact on your credit score
What's your property worth?
Source Acknowledgement: © Crown copyright. England and Wales house price data is publicly available information produced by the HM Land Registry.This material was last updated on 6 August 2025. It covers the period from 1 January 1995 to 30 June 2025 and contains property transactions which have been registered during that period. Contains HM Land Registry data © Crown copyright and database right 2025. This data is licensed under the Open Government Licence v3.0.
Disclaimer: Rightmove.co.uk provides this HM Land Registry data "as is". The burden for fitness of the data relies completely with the user and is provided for informational purposes only. No warranty, express or implied, is given relating to the accuracy of content of the HM Land Registry data and Rightmove does not accept any liability for error or omission. If you have found an error with the data or need further information please contact HM Land Registry.
Permitted Use: Viewers of this Information are granted permission to access this Crown copyright material and to download it onto electronic, magnetic, optical or similar storage media provided that such activities are for private research, study or in-house use only. Any other use of the material requires the formal written permission of Land Registry which can be requested from us, and is subject to an additional licence and associated charge.
Data on planning applications, home extensions and build costs is provided by Resi.co.uk. Planning data is calculated using the last 2 years of residential applications within the selected planning authority. Home extension data, such as build costs and project timelines, are calculated using approximately 9,000 architectural projects Resi has completed, and 23,500 builders quotes submitted via Resi's platform. Build costs are adjusted according to inflation rates to more accurately represent today's prices.
Map data ©OpenStreetMap contributors.
Rightmove takes no liability for your use of, or reliance on, Rightmove's Instant Valuation due to the limitations of our tracking tool listed here. Use of this tool is taken entirely at your own risk. All rights reserved.