
House Prices in Thirston
House prices in Thirston have an overall average of £292,072 over the last year.
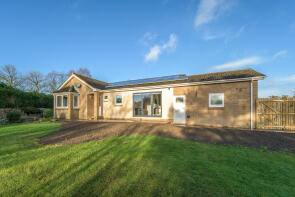
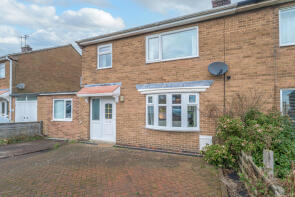
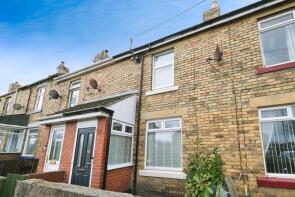
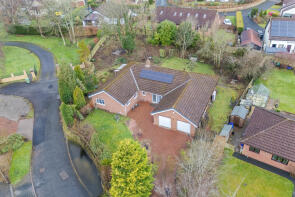
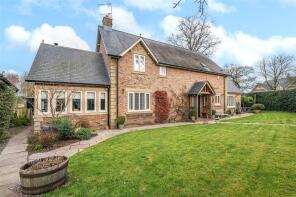
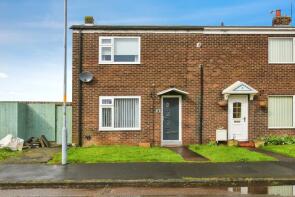
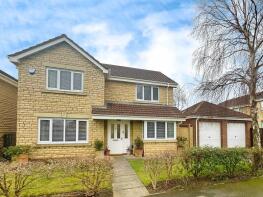
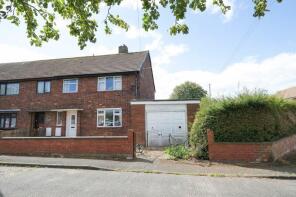
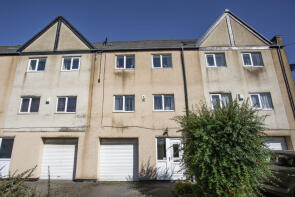
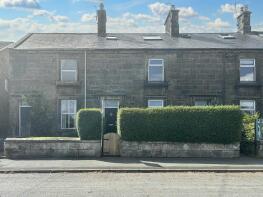
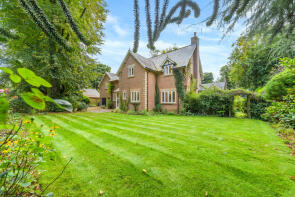
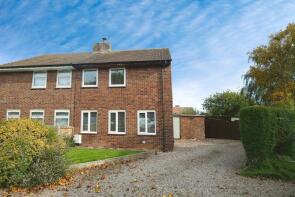
The majority of properties sold in Thirston during the last year were detached properties, selling for an average price of £444,589. Terraced properties sold for an average of £179,611, with semi-detached properties fetching £161,219.
Overall, the historical sold prices in Thirston over the last year were 13% down on the previous year and 23% down on the 2022 peak of £381,383.
Properties Sold
29, Kenmore Road, Morpeth NE65 9JS
| Today | See what it's worth now |
| 16 Jun 2025 | £475,000 |
| 30 Sep 2022 | £390,000 |
17, St Johns Estate, Morpeth NE65 9RX
| Today | See what it's worth now |
| 2 Jun 2025 | £180,000 |
| 31 May 2023 | £175,000 |
2, East View, Morpeth NE65 9TS
| Today | See what it's worth now |
| 29 May 2025 | £95,000 |
| 20 Nov 2020 | £92,500 |
6 Mallor, The Old Tweed Mill, Morpeth NE65 9LX
| Today | See what it's worth now |
| 29 May 2025 | £445,000 |
| 30 Sep 2008 | £285,000 |
No other historical records.
The Old Mill, Stable Drive, Morpeth NE65 9FB
| Today | See what it's worth now |
| 29 May 2025 | £735,000 |
| 30 Jul 2014 | £400,000 |
6, Whitefield Crescent, Morpeth NE65 9SY
| Today | See what it's worth now |
| 2 May 2025 | £125,000 |
| 10 Aug 2016 | £55,000 |
No other historical records.
22, Chevington Green, Morpeth NE65 9AX
| Today | See what it's worth now |
| 16 Apr 2025 | £290,000 |
| 30 Jun 2023 | £248,000 |
1, Cheviot Crescent, Hadston NE65 9SP
| Today | See what it's worth now |
| 11 Apr 2025 | £130,000 |
No other historical records.
12, Rochester Drive, Morpeth NE65 9DS
| Today | See what it's worth now |
| 8 Apr 2025 | £410,000 |
| 23 Mar 2018 | £315,000 |
No other historical records.
62b Braje Cottage, Main Street, Morpeth NE65 9PZ
| Today | See what it's worth now |
| 4 Apr 2025 | £780,000 |
| 2 Jul 2021 | £500,000 |
No other historical records.
Shunting House, Acklington NE65 9BT
| Today | See what it's worth now |
| 31 Mar 2025 | £450,000 |
| 28 Sep 2018 | £410,000 |
2, Acton Crescent, Morpeth NE65 9NF
| Today | See what it's worth now |
| 31 Mar 2025 | £330,000 |
| 26 Jul 2024 | £205,000 |
5, St Johns Estate, Morpeth NE65 9RU
| Today | See what it's worth now |
| 26 Mar 2025 | £150,000 |
| 27 Jan 2016 | £70,000 |
No other historical records.
2, High Steads, Morpeth NE65 9JX
| Today | See what it's worth now |
| 25 Mar 2025 | £200,000 |
| 7 Dec 2012 | £117,500 |
No other historical records.
34, Park View, Morpeth NE65 9DQ
| Today | See what it's worth now |
| 24 Mar 2025 | £372,500 |
| 30 Jun 2021 | £332,000 |
1, Thirston Court, West Moor Farm, Felton NE65 9QE
| Today | See what it's worth now |
| 19 Mar 2025 | £335,000 |
| 23 Nov 2018 | £257,000 |
No other historical records.
5, The Parks, Morpeth NE65 9RL
| Today | See what it's worth now |
| 19 Mar 2025 | £85,000 |
| 13 Oct 2022 | £96,000 |
61, Main Street, Morpeth NE65 9PT
| Today | See what it's worth now |
| 18 Mar 2025 | £295,000 |
| 31 Mar 2022 | £286,596 |
Lister Chase, Stable Drive, Morpeth NE65 9FB
| Today | See what it's worth now |
| 7 Mar 2025 | £705,000 |
| 16 Aug 2019 | £551,500 |
11, Cheviot Crescent, Morpeth NE65 9SP
| Today | See what it's worth now |
| 3 Mar 2025 | £140,000 |
| 1 Sep 2008 | £69,950 |
No other historical records.
39, The Dunes, Morpeth NE65 9RG
| Today | See what it's worth now |
| 28 Feb 2025 | £115,000 |
| 21 Nov 2007 | £142,000 |
No other historical records.
Highfield, Newton-on-the-moor NE65 9JY
| Today | See what it's worth now |
| 21 Feb 2025 | £490,000 |
No other historical records.
2, Robson Grove, Morpeth NE65 9DT
| Today | See what it's worth now |
| 20 Feb 2025 | £161,000 |
| 20 Nov 2017 | £118,996 |
No other historical records.
20, Dene Close, Morpeth NE65 9DH
| Today | See what it's worth now |
| 20 Feb 2025 | £370,000 |
| 17 Jul 2001 | £135,000 |
No other historical records.
Cherry Tree Cottage, B6345 West Thirston Village, Morpeth NE65 9EG
| Today | See what it's worth now |
| 17 Feb 2025 | £338,000 |
| 2 Aug 2002 | £173,000 |
Get ready with a Mortgage in Principle
- Personalised result in just 20 minutes
- Find out how much you can borrow
- Get viewings faster with agents
- No impact on your credit score
What's your property worth?
Source Acknowledgement: © Crown copyright. England and Wales house price data is publicly available information produced by the HM Land Registry.This material was last updated on 6 August 2025. It covers the period from 1 January 1995 to 30 June 2025 and contains property transactions which have been registered during that period. Contains HM Land Registry data © Crown copyright and database right 2025. This data is licensed under the Open Government Licence v3.0.
Disclaimer: Rightmove.co.uk provides this HM Land Registry data "as is". The burden for fitness of the data relies completely with the user and is provided for informational purposes only. No warranty, express or implied, is given relating to the accuracy of content of the HM Land Registry data and Rightmove does not accept any liability for error or omission. If you have found an error with the data or need further information please contact HM Land Registry.
Permitted Use: Viewers of this Information are granted permission to access this Crown copyright material and to download it onto electronic, magnetic, optical or similar storage media provided that such activities are for private research, study or in-house use only. Any other use of the material requires the formal written permission of Land Registry which can be requested from us, and is subject to an additional licence and associated charge.
Map data ©OpenStreetMap contributors.
Rightmove takes no liability for your use of, or reliance on, Rightmove's Instant Valuation due to the limitations of our tracking tool listed here. Use of this tool is taken entirely at your own risk. All rights reserved.