
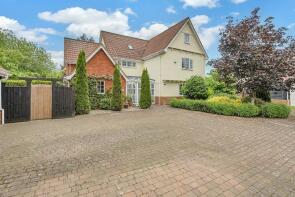
House Prices in Thorndon Hill
House prices in Thorndon Hill have an overall average of £372,446 over the last year.
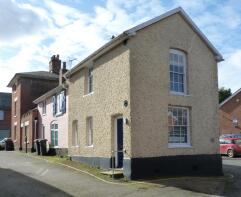
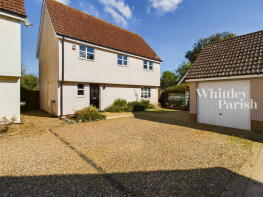
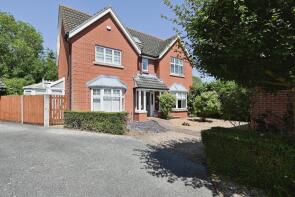
The majority of properties sold in Thorndon Hill during the last year were detached properties, selling for an average price of £450,570. Terraced properties sold for an average of £241,417, with semi-detached properties fetching £278,056.
Overall, the historical sold prices in Thorndon Hill over the last year were 7% up on the previous year and 8% down on the 2022 peak of £406,208.
Properties Sold
12, Millfield, Eye IP23 7DE
| Today | See what it's worth now |
| 20 Jun 2025 | £190,000 |
| 8 May 2007 | £130,000 |
7, Daniel Gardens, Eye IP23 7BQ
| Today | See what it's worth now |
| 6 Jun 2025 | £297,450 |
| 8 Apr 2010 | £172,000 |
12, Highfield, Eye IP23 7BP
| Today | See what it's worth now |
| 28 May 2025 | £250,000 |
| 31 May 2017 | £197,500 |
No other historical records.
1, The Knoll, Eye IP23 7QR

| Today | See what it's worth now |
| 9 May 2025 | £254,000 |
| 26 Jun 2015 | £144,500 |
2, Leam Cottages, Church Street, Eye IP23 7PS


| Today | See what it's worth now |
| 7 May 2025 | £95,000 |
| 26 Oct 2001 | £42,500 |
10, Ashton Road, Eye IP23 7LF
| Today | See what it's worth now |
| 2 May 2025 | £420,000 |
| 5 Feb 2016 | £325,000 |
19, Lowgate Street, Eye IP23 7AS
| Today | See what it's worth now |
| 17 Apr 2025 | £525,000 |
| 28 May 2010 | £335,000 |
19, Fen View, Eye IP23 7JW
| Today | See what it's worth now |
| 16 Apr 2025 | £208,000 |
| 20 Mar 2020 | £180,000 |
26, Kerrison Gardens, Stoke Road, Eye IP23 7JQ
| Today | See what it's worth now |
| 3 Apr 2025 | £238,000 |
| 18 Jun 2021 | £230,000 |
No other historical records.
5, Cedars Rise, Eye IP23 7QA
| Today | See what it's worth now |
| 31 Mar 2025 | £315,000 |
| 17 Jul 2020 | £235,000 |
No other historical records.
Conifers, The Street, Bedingfield IP23 7LQ

| Today | See what it's worth now |
| 28 Mar 2025 | £340,000 |
No other historical records.
19, Ash Tree Close, Eye IP23 7LD
| Today | See what it's worth now |
| 28 Mar 2025 | £278,000 |
| 12 Aug 2022 | £290,000 |
White Barn Cottage, The Street, Eye IP23 7JR
| Today | See what it's worth now |
| 28 Mar 2025 | £400,000 |
| 29 Aug 2001 | £155,000 |
29, Castle Street, Eye IP23 7AW

| Today | See what it's worth now |
| 25 Mar 2025 | £535,000 |
No other historical records.
23, Century Road, Eye IP23 7LE
| Today | See what it's worth now |
| 20 Mar 2025 | £438,000 |
| 23 Jun 2005 | £248,000 |
24, Wellington Road, Eye IP23 7BG
| Today | See what it's worth now |
| 14 Mar 2025 | £240,000 |
| 4 Nov 2020 | £255,000 |
1 The Grange, Langton Park, Eye IP23 7LZ
| Today | See what it's worth now |
| 12 Mar 2025 | £825,000 |
| 8 Jun 2010 | £655,000 |
8, Cross Street, Eye IP23 7AB
| Today | See what it's worth now |
| 12 Mar 2025 | £110,000 |
| 16 Nov 2017 | £135,500 |
No other historical records.
3, Town Garden, The Street, Eye IP23 7JR
| Today | See what it's worth now |
| 11 Mar 2025 | £350,000 |
| 28 Apr 2006 | £240,000 |
No other historical records.
7, Tuffs Road, Eye IP23 7LY
| Today | See what it's worth now |
| 7 Mar 2025 | £455,000 |
| 11 Jul 2013 | £292,500 |
Junedale, Chapel Lane, Stoke Ash IP23 7EU
| Today | See what it's worth now |
| 5 Mar 2025 | £425,000 |
No other historical records.
3, The Knoll, Eye IP23 7QR
| Today | See what it's worth now |
| 28 Feb 2025 | £208,000 |
| 9 Dec 2022 | £200,000 |
No other historical records.
4, Park Road, Eye IP23 7QW
| Today | See what it's worth now |
| 28 Feb 2025 | £500,000 |
| 25 Nov 2009 | £320,000 |
4, Century Road, Eye IP23 7LE

| Today | See what it's worth now |
| 28 Feb 2025 | £475,000 |
| 19 Jan 2001 | £169,550 |
No other historical records.
The Pightle Bungalow, Church Street, Eye IP23 7PS
| Today | See what it's worth now |
| 26 Feb 2025 | £490,000 |
| 30 Apr 2010 | £250,000 |
No other historical records.
Get ready with a Mortgage in Principle
- Personalised result in just 20 minutes
- Find out how much you can borrow
- Get viewings faster with agents
- No impact on your credit score
What's your property worth?
Source Acknowledgement: © Crown copyright. England and Wales house price data is publicly available information produced by the HM Land Registry.This material was last updated on 6 August 2025. It covers the period from 1 January 1995 to 30 June 2025 and contains property transactions which have been registered during that period. Contains HM Land Registry data © Crown copyright and database right 2025. This data is licensed under the Open Government Licence v3.0.
Disclaimer: Rightmove.co.uk provides this HM Land Registry data "as is". The burden for fitness of the data relies completely with the user and is provided for informational purposes only. No warranty, express or implied, is given relating to the accuracy of content of the HM Land Registry data and Rightmove does not accept any liability for error or omission. If you have found an error with the data or need further information please contact HM Land Registry.
Permitted Use: Viewers of this Information are granted permission to access this Crown copyright material and to download it onto electronic, magnetic, optical or similar storage media provided that such activities are for private research, study or in-house use only. Any other use of the material requires the formal written permission of Land Registry which can be requested from us, and is subject to an additional licence and associated charge.
Map data ©OpenStreetMap contributors.
Rightmove takes no liability for your use of, or reliance on, Rightmove's Instant Valuation due to the limitations of our tracking tool listed here. Use of this tool is taken entirely at your own risk. All rights reserved.