
House Prices in Thorpe Next Norwich
House prices in Thorpe Next Norwich have an overall average of £343,694 over the last year.
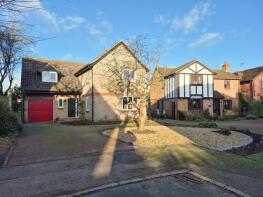
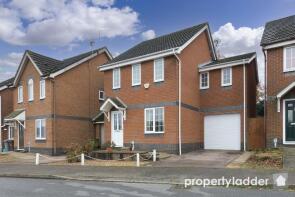
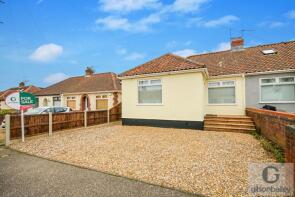
The majority of properties sold in Thorpe Next Norwich during the last year were semi-detached properties, selling for an average price of £294,500. Detached properties sold for an average of £434,207, with terraced properties fetching £288,324.
Overall, the historical sold prices in Thorpe Next Norwich over the last year were 11% up on the previous year and 3% up on the 2022 peak of £334,084.
Properties Sold
24, Beechwood Drive, Thorpe St Andrew NR7 0LP

| Today | See what it's worth now |
| 19 Jun 2025 | £360,000 |
No other historical records.
98, Saint Williams Way, Norwich NR7 0AP
| Today | See what it's worth now |
| 9 Jun 2025 | £275,000 |
| 15 May 2006 | £170,000 |
10, Chapel Lane, Norwich NR7 0EX
| Today | See what it's worth now |
| 6 Jun 2025 | £365,000 |
| 24 Jun 2016 | £300,000 |
5, Tower Hill, Norwich NR7 0EL
| Today | See what it's worth now |
| 6 Jun 2025 | £312,500 |
| 15 Mar 2021 | £275,000 |
2c, Boulton Road, Thorpe St Andrew NR7 0DF


| Today | See what it's worth now |
| 30 May 2025 | £325,000 |
No other historical records.
26, South Hill Close, Thorpe St Andrew NR7 0NQ
| Today | See what it's worth now |
| 27 May 2025 | £537,500 |
No other historical records.
21, Desborough Way, Norwich NR7 0RR

| Today | See what it's worth now |
| 23 May 2025 | £230,000 |
| 20 May 1997 | £48,500 |
No other historical records.
5, Parliament Court, Norwich NR7 0TG
| Today | See what it's worth now |
| 22 May 2025 | £200,000 |
| 23 Dec 1998 | £47,250 |
13, Pilling Road, Norwich NR7 0DL
| Today | See what it's worth now |
| 19 May 2025 | £306,000 |
| 26 Oct 2017 | £222,500 |
No other historical records.
12 Crosby, Birchwood, Norwich NR7 0RL
| Today | See what it's worth now |
| 16 May 2025 | £419,000 |
| 1 Jul 2019 | £300,000 |
No other historical records.
41 Haselmere, Thunder Lane, Norwich NR7 0PX
| Today | See what it's worth now |
| 15 May 2025 | £512,500 |
| 23 Apr 2014 | £307,000 |
No other historical records.
68, Howard Close, Thorpe St Andrew NR7 0LE
| Today | See what it's worth now |
| 9 May 2025 | £525,000 |
No other historical records.
56, Association Way, Norwich NR7 0TQ

| Today | See what it's worth now |
| 2 May 2025 | £190,000 |
| 7 Jan 2022 | £172,000 |
1, Meadow Lane, Thorpe St Andrew NR7 0QX
| Today | See what it's worth now |
| 2 May 2025 | £245,000 |
No other historical records.
23, Roundway Down, Norwich NR7 0NR
| Today | See what it's worth now |
| 2 May 2025 | £337,500 |
| 12 Sep 1995 | £63,250 |
No other historical records.
36, Thor Close, Norwich NR7 0JT
| Today | See what it's worth now |
| 30 Apr 2025 | £320,000 |
| 8 Aug 2001 | £86,000 |
4, Green Court, Thorpe St Andrew NR7 0LQ
| Today | See what it's worth now |
| 25 Apr 2025 | £110,000 |
| 20 Aug 2008 | £68,046 |
46, Bishops Close, Thorpe St Andrew NR7 0DY
| Today | See what it's worth now |
| 15 Apr 2025 | £435,000 |
No other historical records.
5, Thor Road, Norwich NR7 0JS
| Today | See what it's worth now |
| 11 Apr 2025 | £250,000 |
| 19 Dec 2008 | £125,000 |
No other historical records.
18, Henby Way, Norwich NR7 0LD

| Today | See what it's worth now |
| 31 Mar 2025 | £450,000 |
| 19 Sep 2014 | £250,000 |
No other historical records.
9, Thomas Vere Road, Norwich NR7 0XT
| Today | See what it's worth now |
| 31 Mar 2025 | £245,000 |
| 5 May 2015 | £161,500 |
39, Thorpe Hall Close, Norwich NR7 0TH
| Today | See what it's worth now |
| 28 Mar 2025 | £381,000 |
| 30 Jul 2010 | £126,884 |
3, Dowsing Court, Norwich NR7 0RW
| Today | See what it's worth now |
| 28 Mar 2025 | £340,000 |
| 15 Sep 2020 | £269,995 |
61, Furze Road, Norwich NR7 0AT

| Today | See what it's worth now |
| 28 Mar 2025 | £275,000 |
| 28 Jul 2021 | £250,000 |
12, Musketeer Way, Norwich NR7 0YW
| Today | See what it's worth now |
| 28 Mar 2025 | £325,000 |
| 16 Mar 2016 | £275,000 |
Get ready with a Mortgage in Principle
- Personalised result in just 20 minutes
- Find out how much you can borrow
- Get viewings faster with agents
- No impact on your credit score
What's your property worth?
Source Acknowledgement: © Crown copyright. England and Wales house price data is publicly available information produced by the HM Land Registry.This material was last updated on 6 August 2025. It covers the period from 1 January 1995 to 30 June 2025 and contains property transactions which have been registered during that period. Contains HM Land Registry data © Crown copyright and database right 2025. This data is licensed under the Open Government Licence v3.0.
Disclaimer: Rightmove.co.uk provides this HM Land Registry data "as is". The burden for fitness of the data relies completely with the user and is provided for informational purposes only. No warranty, express or implied, is given relating to the accuracy of content of the HM Land Registry data and Rightmove does not accept any liability for error or omission. If you have found an error with the data or need further information please contact HM Land Registry.
Permitted Use: Viewers of this Information are granted permission to access this Crown copyright material and to download it onto electronic, magnetic, optical or similar storage media provided that such activities are for private research, study or in-house use only. Any other use of the material requires the formal written permission of Land Registry which can be requested from us, and is subject to an additional licence and associated charge.
Map data ©OpenStreetMap contributors.
Rightmove takes no liability for your use of, or reliance on, Rightmove's Instant Valuation due to the limitations of our tracking tool listed here. Use of this tool is taken entirely at your own risk. All rights reserved.