
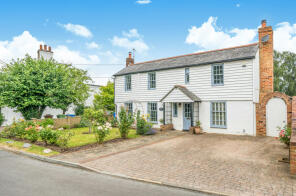
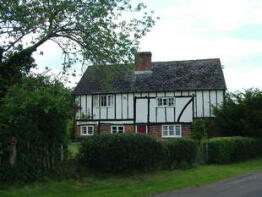
House Prices in Torry Hill
House prices in Torry Hill have an overall average of £535,605 over the last year.
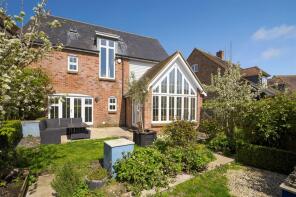
The majority of properties sold in Torry Hill during the last year were detached properties, selling for an average price of £691,750. Semi-detached properties sold for an average of £363,583, with terraced properties fetching £359,167.
Overall, the historical sold prices in Torry Hill over the last year were 8% down on the previous year and 16% down on the 2022 peak of £634,897.
Properties Sold
2, Yew Tree Cottage, The Street, Doddington, Sittingbourne, Kent ME9 0BH


| Today | See what it's worth now |
| 28 Jan 2025 | £325,000 |
| 12 Aug 2019 | £250,000 |
Rose Cottage, Bottles Lane, Rodmersham, Sittingbourne, Kent ME9 0PR
| Today | See what it's worth now |
| 7 Jan 2025 | £825,000 |
| 22 Jan 2021 | £620,000 |
Hollybush Cottage, Holly Bushes, Milstead, Sittingbourne, Kent ME9 0SF
| Today | See what it's worth now |
| 10 Dec 2024 | £760,000 |
| 25 Aug 2011 | £440,000 |
No other historical records.
Japonica Cottage, Ludgate Lane, Lynsted, Sittingbourne, Kent ME9 0RQ

| Today | See what it's worth now |
| 3 Dec 2024 | £800,000 |
| 24 Jan 2014 | £565,000 |
13, The Terrace, Doddington, Sittingbourne, Kent ME9 0BL

| Today | See what it's worth now |
| 29 Nov 2024 | £245,500 |
| 20 Dec 2013 | £140,000 |
Wisteria, Lynsted, Sittingbourne, Kent ME9 0RH

| Today | See what it's worth now |
| 29 Nov 2024 | £480,000 |
| 24 Sep 2021 | £512,500 |
No other historical records.
6, St Pauls Court, Lynsted, Sittingbourne, Kent ME9 0RE
| Today | See what it's worth now |
| 29 Oct 2024 | £507,000 |
| 9 Jan 2014 | £395,000 |
Winsgate, Doddington, Sittingbourne, Kent ME9 0AY

| Today | See what it's worth now |
| 25 Sep 2024 | £700,000 |
| 14 Oct 1998 | £148,500 |
No other historical records.
Fair View, Bottom Pond Road, Wormshill, Sittingbourne, Kent ME9 0TN

| Today | See what it's worth now |
| 6 Sep 2024 | £720,000 |
| 29 Aug 2019 | £407,500 |
No other historical records.
Orchard View, Milstead, Sittingbourne, Kent ME9 0SQ

| Today | See what it's worth now |
| 28 Aug 2024 | £520,000 |
No other historical records.
Greenways, The Street, Wormshill, Sittingbourne, Kent ME9 0TU
| Today | See what it's worth now |
| 5 Aug 2024 | £780,000 |
| 9 Nov 1999 | £230,000 |
No other historical records.
Carn House, The Vallance, Lynsted, Sittingbourne, Kent ME9 0RP
| Today | See what it's worth now |
| 25 Jun 2024 | £725,000 |
| 30 Aug 2002 | �£325,000 |
No other historical records.
8a, North Down, Doddington, Sittingbourne, Kent ME9 0BQ

| Today | See what it's worth now |
| 21 Jun 2024 | £350,000 |
| 28 Jan 2022 | £350,000 |
2, St Peters Place, Lynsted, Sittingbourne, Kent ME9 0RJ
| Today | See what it's worth now |
| 3 Jun 2024 | £392,500 |
| 14 Sep 2018 | £317,000 |
1, Forstall Cottages, Chequers Hill, Doddington, Sittingbourne, Kent ME9 0BN

| Today | See what it's worth now |
| 10 May 2024 | £395,000 |
No other historical records.
Homewood, Homestall Road, Doddington, Sittingbourne, Kent ME9 0HF

| Today | See what it's worth now |
| 2 May 2024 | £334,000 |
No other historical records.
73, The Street, Newnham, Sittingbourne, Kent ME9 0LW
| Today | See what it's worth now |
| 19 Apr 2024 | £325,000 |
No other historical records.
Red Roofs, Highsted Valley, Rodmersham, Sittingbourne, Kent ME9 0AB
| Today | See what it's worth now |
| 5 Apr 2024 | £607,500 |
| 3 Dec 2012 | £393,000 |
Walnut Tree Cottage, Old Lenham Road, Doddington, Sittingbourne, Kent ME9 0BX

| Today | See what it's worth now |
| 2 Apr 2024 | £385,000 |
| 19 Mar 2021 | £350,000 |
No other historical records.
East Cottage, Horn Hill, Milstead, Sittingbourne, Kent ME9 0SD
| Today | See what it's worth now |
| 8 Feb 2024 | £310,000 |
No other historical records.
Conway, Highsted Valley, Rodmersham, Sittingbourne, Kent ME9 0AB

| Today | See what it's worth now |
| 7 Feb 2024 | £330,000 |
No other historical records.
Church House, Church Street, Rodmersham, Sittingbourne, Kent ME9 0QD
| Today | See what it's worth now |
| 24 Jan 2024 | £1,600,000 |
| 22 Aug 2005 | £1,100,000 |
11, Fruiterers Close, Rodmersham, Sittingbourne, Kent ME9 0PB
| Today | See what it's worth now |
| 18 Jan 2024 | £272,000 |
No other historical records.
55, The Street, Newnham, Sittingbourne, Kent ME9 0LN

| Today | See what it's worth now |
| 11 Dec 2023 | £460,000 |
No other historical records.
Rapsons, The Street, Doddington, Sittingbourne, Kent ME9 0BH

| Today | See what it's worth now |
| 17 Nov 2023 | £760,000 |
| 21 Nov 2008 | £465,000 |
Get ready with a Mortgage in Principle
- Personalised result in just 20 minutes
- Find out how much you can borrow
- Get viewings faster with agents
- No impact on your credit score
What's your property worth?
Source Acknowledgement: © Crown copyright. England and Wales house price data is publicly available information produced by the HM Land Registry.This material was last updated on 17 April 2025. It covers the period from 1 January 1995 to 28 February 2025 and contains property transactions which have been registered during that period. Contains HM Land Registry data © Crown copyright and database right 2025. This data is licensed under the Open Government Licence v3.0.
Disclaimer: Rightmove.co.uk provides this HM Land Registry data "as is". The burden for fitness of the data relies completely with the user and is provided for informational purposes only. No warranty, express or implied, is given relating to the accuracy of content of the HM Land Registry data and Rightmove does not accept any liability for error or omission. If you have found an error with the data or need further information please contact HM Land Registry.
Permitted Use: Viewers of this Information are granted permission to access this Crown copyright material and to download it onto electronic, magnetic, optical or similar storage media provided that such activities are for private research, study or in-house use only. Any other use of the material requires the formal written permission of Land Registry which can be requested from us, and is subject to an additional licence and associated charge.
Map data ©OpenStreetMap contributors.
Rightmove takes no liability for your use of, or reliance on, Rightmove's Instant Valuation due to the limitations of our tracking tool listed here. Use of this tool is taken entirely at your own risk. All rights reserved.