
House Prices in TQ5
House prices in TQ5 have an overall average of £338,754 over the last year.
The majority of properties sold in TQ5 during the last year were detached properties, selling for an average price of £478,938. Semi-detached properties sold for an average of £297,317, with terraced properties fetching £304,643.
Overall, the historical sold prices in TQ5 over the last year were 3% up on the previous year and 2% down on the 2022 peak of £346,160.
Properties Sold
2, Vigilance Avenue, Brixham TQ5 9FL
| Today | See what it's worth now |
| 20 Jun 2025 | £425,000 |
| 30 Jun 2016 | £259,950 |
No other historical records.
113, Summercourt Way, Brixham TQ5 0RB
| Today | See what it's worth now |
| 13 Jun 2025 | £585,000 |
| 3 Dec 2013 | £280,000 |
4, Mount Road, Brixham TQ5 9SA

| Today | See what it's worth now |
| 10 Jun 2025 | £345,000 |
| 5 Nov 2009 | £245,000 |
Flat 7, Berry Court, Heath Road, Brixham TQ5 9UJ
| Today | See what it's worth now |
| 29 May 2025 | £242,500 |
| 12 Jun 2020 | £200,000 |
No other historical records.
64, Burton Street, Brixham TQ5 9JA
| Today | See what it's worth now |
| 29 May 2025 | £175,000 |
| 11 Mar 2016 | £136,500 |
16, Pillar Close, Brixham TQ5 8LD
| Today | See what it's worth now |
| 29 May 2025 | £230,000 |
| 20 Nov 2009 | £152,500 |
17, Garrow Close, Brixham TQ5 9NN
| Today | See what it's worth now |
| 28 May 2025 | £180,000 |
No other historical records.
Flat 6, 88-90, New Road, Brixham TQ5 8BZ
| Today | See what it's worth now |
| 23 May 2025 | £190,000 |
| 2 Jun 2017 | £177,500 |
Graylings, Bascombe Road, Churston Ferrers, Brixham TQ5 0JX
| Today | See what it's worth now |
| 22 May 2025 | £745,000 |
No other historical records.
4, Somerset Court, Mount Pleasant Road, Brixham TQ5 9RX

| Today | See what it's worth now |
| 9 May 2025 | £181,000 |
| 30 Sep 2019 | £190,000 |
1, Higher Penn, Brixham TQ5 9PA
| Today | See what it's worth now |
| 9 May 2025 | £230,000 |
| 29 Aug 2006 | £174,000 |
No other historical records.
24, Parkham Glade, Brixham TQ5 9JS


| Today | See what it's worth now |
| 30 Apr 2025 | �£146,962 |
No other historical records.
Flat 1, Windmill Court, Windmill Hill, Brixham TQ5 9HG
| Today | See what it's worth now |
| 25 Apr 2025 | £146,000 |
| 31 Jul 2014 | £124,500 |
No other historical records.
89, Penn Meadows, Brixham TQ5 9PF
| Today | See what it's worth now |
| 24 Apr 2025 | £244,000 |
| 8 Dec 2000 | £78,000 |
No other historical records.
Flat 23, Devoncourt, Berry Head Road, Brixham TQ5 9AB

| Today | See what it's worth now |
| 15 Apr 2025 | £195,000 |
No other historical records.
3, Frogwell Cottages, Dashpers, Brixham TQ5 9LG

| Today | See what it's worth now |
| 14 Apr 2025 | £238,000 |
| 2 Jun 2016 | £167,000 |
21, Churston Way, Brixham TQ5 8DE
| Today | See what it's worth now |
| 11 Apr 2025 | £340,000 |
| 22 Nov 2019 | £270,000 |
Flat 12, Albion Court, Castor Road, Brixham TQ5 9PY
| Today | See what it's worth now |
| 11 Apr 2025 | £140,000 |
| 5 May 2023 | £125,000 |
30, Prospect Road, Brixham TQ5 8HS
| Today | See what it's worth now |
| 31 Mar 2025 | £257,000 |
| 4 Dec 2020 | £216,000 |
Clova, Lower Rea Road, Brixham TQ5 9UD
| Today | See what it's worth now |
| 31 Mar 2025 | £530,000 |
| 15 Jul 2022 | £260,000 |
No other historical records.
10, North View Road, Brixham TQ5 9TT
| Today | See what it's worth now |
| 31 Mar 2025 | £485,000 |
| 5 Aug 2016 | £335,000 |
28, Pavilions Close, Brixham TQ5 8BU
| Today | See what it's worth now |
| 31 Mar 2025 | £285,000 |
| 6 Oct 2016 | £203,000 |
3, Heath Park, Brixham TQ5 9BJ
| Today | See what it's worth now |
| 28 Mar 2025 | £305,000 |
No other historical records.
43, Moorings Reach, Brixham TQ5 9TB

| Today | See what it's worth now |
| 28 Mar 2025 | £650,000 |
| 25 Jun 1999 | £179,950 |
No other historical records.
11, Beverley Rise, Brixham TQ5 9NQ
| Today | See what it's worth now |
| 27 Mar 2025 | £395,000 |
| 24 Jun 2021 | £360,000 |
Find out how much your property is worth
The following agents can provide you with a free, no-obligation valuation. Simply select the ones you'd like to hear from.
Sponsored
All featured agents have paid a fee to promote their valuation expertise.

Boyce Brixham
Brixham

Yopa
Midlands, South West & Wales

Absolute
Brixham

Eric Lloyd & Co
Brixham

Bradleys
Brixham
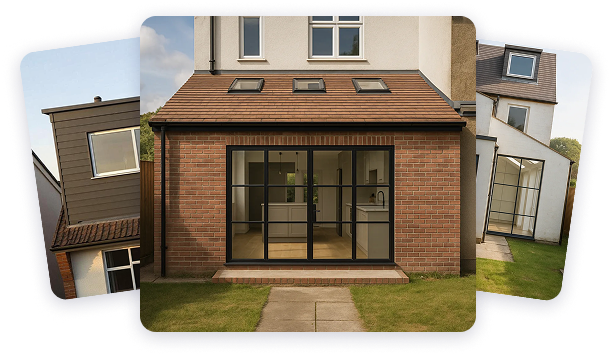
Get ready with a Mortgage in Principle
- Personalised result in just 20 minutes
- Find out how much you can borrow
- Get viewings faster with agents
- No impact on your credit score
Source Acknowledgement: © Crown copyright. England and Wales house price data is publicly available information produced by the HM Land Registry.This material was last updated on 6 August 2025. It covers the period from 1 January 1995 to 30 June 2025 and contains property transactions which have been registered during that period. Contains HM Land Registry data © Crown copyright and database right 2025. This data is licensed under the Open Government Licence v3.0.
Disclaimer: Rightmove.co.uk provides this HM Land Registry data "as is". The burden for fitness of the data relies completely with the user and is provided for informational purposes only. No warranty, express or implied, is given relating to the accuracy of content of the HM Land Registry data and Rightmove does not accept any liability for error or omission. If you have found an error with the data or need further information please contact HM Land Registry.
Permitted Use: Viewers of this Information are granted permission to access this Crown copyright material and to download it onto electronic, magnetic, optical or similar storage media provided that such activities are for private research, study or in-house use only. Any other use of the material requires the formal written permission of Land Registry which can be requested from us, and is subject to an additional licence and associated charge.
Data on planning applications, home extensions and build costs is provided by Resi.co.uk. Planning data is calculated using the last 2 years of residential applications within the selected planning authority. Home extension data, such as build costs and project timelines, are calculated using approximately 9,000 architectural projects Resi has completed, and 23,500 builders quotes submitted via Resi's platform. Build costs are adjusted according to inflation rates to more accurately represent today's prices.
Map data ©OpenStreetMap contributors.
Rightmove takes no liability for your use of, or reliance on, Rightmove's Instant Valuation due to the limitations of our tracking tool listed here. Use of this tool is taken entirely at your own risk. All rights reserved.