
House Prices in TS12
House prices in TS12 have an overall average of £200,188 over the last year.
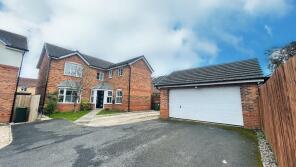
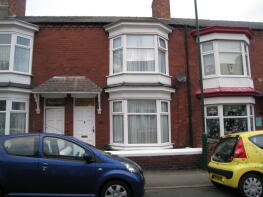
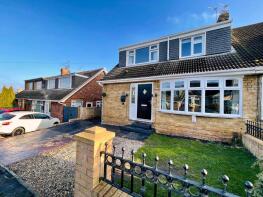
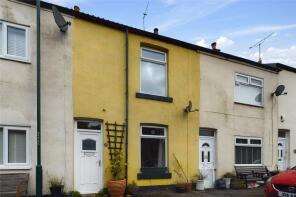
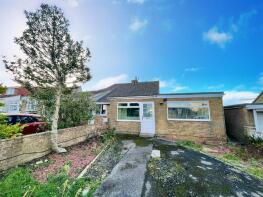
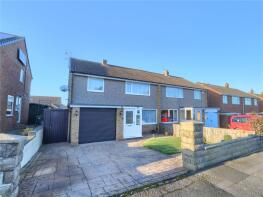
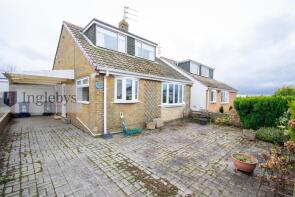
The majority of properties sold in TS12 during the last year were terraced properties, selling for an average price of £166,752. Semi-detached properties sold for an average of £193,835, with detached properties fetching £309,490.
Overall, the historical sold prices in TS12 over the last year were similar to the previous year and similar to the 2022 peak of £198,568.
Properties Sold
40, Applethwaite Gardens, Saltburn-by-the-sea TS12 2WF
| Today | See what it's worth now |
| 24 Jun 2025 | £320,000 |
| 25 Aug 2023 | £294,000 |
No other historical records.
21a, Eden Street, Saltburn-by-the-sea TS12 1JZ
| Today | See what it's worth now |
| 16 Jun 2025 | £255,000 |
| 9 Jun 2014 | £140,000 |
40, Eden Road, Saltburn-by-the-sea TS12 2NB
| Today | See what it's worth now |
| 16 Jun 2025 | £214,500 |
| 30 Sep 2022 | £205,000 |
40, Front Street, Charltons TS12 3DB
| Today | See what it's worth now |
| 16 Jun 2025 | £115,000 |
No other historical records.
46, Newlands Road, Saltburn-by-the-sea TS12 2DR
| Today | See what it's worth now |
| 13 Jun 2025 | £130,000 |
| 29 Jul 2005 | £131,000 |
80, Wilton Bank, Saltburn By The Sea TS12 1NU
| Today | See what it's worth now |
| 13 Jun 2025 | £195,000 |
No other historical records.
63, Newlands Road, Saltburn-by-the-sea TS12 2DP
| Today | See what it's worth now |
| 13 Jun 2025 | £200,000 |
| 12 Jul 2002 | £92,000 |
No other historical records.
Flat 22, Zetland Apartments, Marine Parade, Saltburn-by-the-sea TS12 1BU

| Today | See what it's worth now |
| 12 Jun 2025 | £475,000 |
| 15 Dec 2004 | £150,500 |
20, Rodney Close, Saltburn-by-the-sea TS12 2GB
| Today | See what it's worth now |
| 9 Jun 2025 | £148,000 |
| 19 Sep 2014 | £122,500 |
86, Irvin Avenue, Saltburn-by-the-sea TS12 1QP
| Today | See what it's worth now |
| 9 Jun 2025 | £181,000 |
| 22 Jan 2016 | £118,500 |
12, Copeland Close, Saltburn-by-the-sea TS12 2WL


| Today | See what it's worth now |
| 2 Jun 2025 | £175,000 |
| 31 Jan 2022 | £149,995 |
18, Calderdale, Saltburn-by-the-sea TS12 2WD
| Today | See what it's worth now |
| 2 Jun 2025 | £340,000 |
| 27 Jun 2013 | £205,000 |
30, Foster Street, Saltburn-by-the-sea TS12 2TR

| Today | See what it's worth now |
| 2 Jun 2025 | £80,000 |
| 17 Nov 2006 | £69,000 |
7, Burley Close, Saltburn-by-the-sea TS12 2PW
| Today | See what it's worth now |
| 30 May 2025 | £127,500 |
| 23 Jun 2023 | £109,000 |
12, Davison Street, Saltburn-by-the-sea TS12 3DX

| Today | See what it's worth now |
| 29 May 2025 | £87,999 |
| 20 Nov 2006 | £84,000 |
8, Longthwaite Close, Saltburn-by-the-sea TS12 2WP

| Today | See what it's worth now |
| 29 May 2025 | £367,500 |
| 7 Jul 2017 | £209,000 |
14, The Hollies, Holmbeck Road, Saltburn-by-the-sea TS12 2EH
| Today | See what it's worth now |
| 27 May 2025 | £109,000 |
| 14 Dec 2010 | £125,000 |
No other historical records.
14, Langbaurgh Court, Marine Parade, Saltburn By The Sea TS12 1ET

| Today | See what it's worth now |
| 23 May 2025 | £170,000 |
| 25 May 2001 | £52,000 |
No other historical records.
14, Bluebell Way, Saltburn-by-the-sea TS12 2FB
| Today | See what it's worth now |
| 19 May 2025 | £244,950 |
| 11 Jul 2022 | £240,000 |
27, Cleveland View, Saltburn-by-the-sea TS12 2DL
| Today | See what it's worth now |
| 19 May 2025 | £289,000 |
| 12 Oct 2006 | £237,000 |
Hazelhurst, Marske Mill Lane, Saltburn-by-the-sea TS12 1HT
| Today | See what it's worth now |
| 16 May 2025 | £875,000 |
| 20 Aug 2003 | £450,000 |
92, Charltonsfield, High Street, Saltburn-by-the-sea TS12 3JP
| Today | See what it's worth now |
| 16 May 2025 | £140,000 |
| 2 Sep 2016 | £98,000 |
21, Charlotte Street, New Skelton, Saltburn-by-the-sea TS12 2AF

| Today | See what it's worth now |
| 13 May 2025 | £135,000 |
No other historical records.
Flat, 5, Cambridge Street, Saltburn-by-the-sea TS12 1LD
| Today | See what it's worth now |
| 9 May 2025 | £180,000 |
| 28 Sep 2001 | £39,500 |
No other historical records.
52, Marlborough Road, Skelton-in-cleveland TS12 2JH
| Today | See what it's worth now |
| 2 May 2025 | £150,000 |
No other historical records.
Find out how much your property is worth
The following agents can provide you with a free, no-obligation valuation. Simply select the ones you'd like to hear from.
Sponsored
All featured agents have paid a fee to promote their valuation expertise.

Inglebys Estate Agents
Saltburn-By-The-Sea

G.R. Estates
Stockton-on-Tees

Martin & Co
Guisborough

Leapfrog Lettings & Sales
Skelton-in-Cleveland

Michael Poole
Redcar
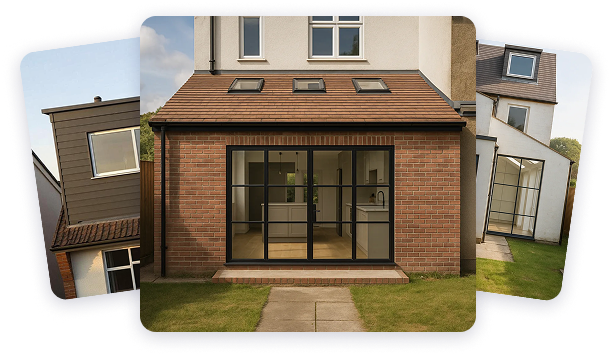
Get ready with a Mortgage in Principle
- Personalised result in just 20 minutes
- Find out how much you can borrow
- Get viewings faster with agents
- No impact on your credit score
What's your property worth?
Source Acknowledgement: © Crown copyright. England and Wales house price data is publicly available information produced by the HM Land Registry.This material was last updated on 6 August 2025. It covers the period from 1 January 1995 to 30 June 2025 and contains property transactions which have been registered during that period. Contains HM Land Registry data © Crown copyright and database right 2025. This data is licensed under the Open Government Licence v3.0.
Disclaimer: Rightmove.co.uk provides this HM Land Registry data "as is". The burden for fitness of the data relies completely with the user and is provided for informational purposes only. No warranty, express or implied, is given relating to the accuracy of content of the HM Land Registry data and Rightmove does not accept any liability for error or omission. If you have found an error with the data or need further information please contact HM Land Registry.
Permitted Use: Viewers of this Information are granted permission to access this Crown copyright material and to download it onto electronic, magnetic, optical or similar storage media provided that such activities are for private research, study or in-house use only. Any other use of the material requires the formal written permission of Land Registry which can be requested from us, and is subject to an additional licence and associated charge.
Data on planning applications, home extensions and build costs is provided by Resi.co.uk. Planning data is calculated using the last 2 years of residential applications within the selected planning authority. Home extension data, such as build costs and project timelines, are calculated using approximately 9,000 architectural projects Resi has completed, and 23,500 builders quotes submitted via Resi's platform. Build costs are adjusted according to inflation rates to more accurately represent today's prices.
Map data ©OpenStreetMap contributors.
Rightmove takes no liability for your use of, or reliance on, Rightmove's Instant Valuation due to the limitations of our tracking tool listed here. Use of this tool is taken entirely at your own risk. All rights reserved.