
House Prices in Wallsend
House prices in Wallsend have an overall average of £170,218 over the last year.
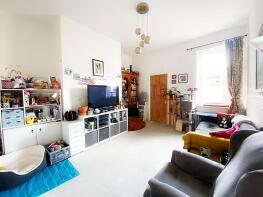
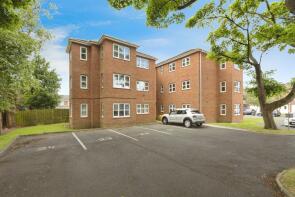
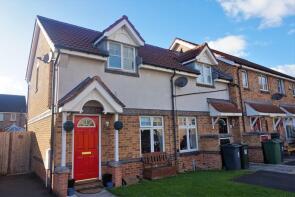
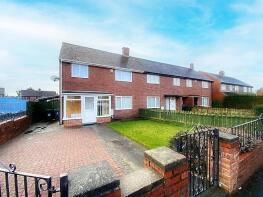
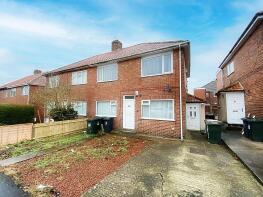
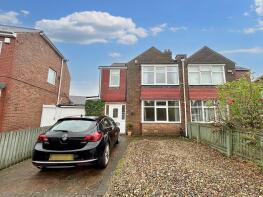
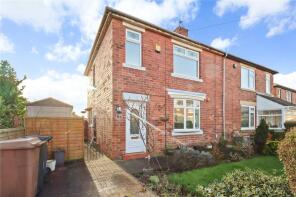
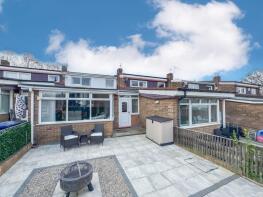
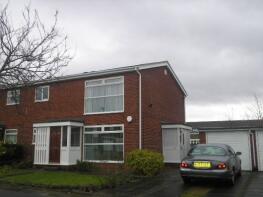
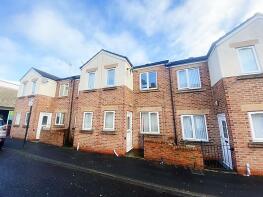
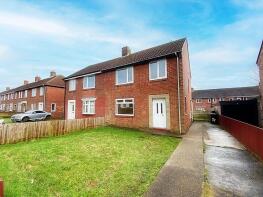
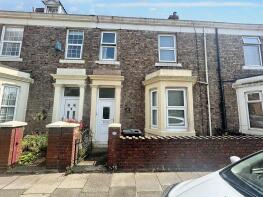
The majority of properties sold in Wallsend during the last year were terraced properties, selling for an average price of £148,576. Semi-detached properties sold for an average of £179,177, with flats fetching £84,672.
Overall, the historical sold prices in Wallsend over the last year were 2% up on the previous year and 4% up on the 2022 peak of £163,167.
Properties Sold
2, Meldon Street, East Howdon, Wallsend NE28 0JY


| Today | See what it's worth now |
| 24 Jun 2025 | £135,000 |
| 14 Oct 2021 | £210,000 |
24b, The Avenue, Wallsend NE28 6BT
| Today | See what it's worth now |
| 20 Jun 2025 | £87,500 |
| 20 May 2022 | £83,000 |
82, Ohanlon Crescent, High Farm, Wallsend NE28 9ES

| Today | See what it's worth now |
| 20 Jun 2025 | £139,950 |
| 17 Apr 2014 | £88,500 |
No other historical records.
23, Tree Top Mews, Wallsend NE28 9EH
| Today | See what it's worth now |
| 19 Jun 2025 | £110,000 |
| 16 Jul 2021 | £78,000 |
31, Bathgate Close, Battle Hill, Wallsend NE28 9SU

| Today | See what it's worth now |
| 17 Jun 2025 | £132,000 |
No other historical records.
94, Church View, Wallsend NE28 6PU
| Today | See what it's worth now |
| 9 Jun 2025 | £148,000 |
| 12 Jan 2018 | £129,000 |
30, Cheshire Gardens, Wallsend NE28 8EE
| Today | See what it's worth now |
| 9 Jun 2025 | £172,500 |
No other historical records.
280 Louvaine, Churchill Street, Wallsend NE28 7TL
| Today | See what it's worth now |
| 6 Jun 2025 | £152,500 |
| 29 Oct 2003 | £87,950 |
5, Churchill Street, Wallsend NE28 7SZ
| Today | See what it's worth now |
| 6 Jun 2025 | £130,000 |
| 15 Feb 2022 | £110,000 |
174, Bewick Park, Wallsend NE28 9RZ
| Today | See what it's worth now |
| 6 Jun 2025 | £297,000 |
| 4 Aug 2017 | £195,000 |
8, Warkworth Avenue, Kings Estate, Wallsend NE28 9HY
| Today | See what it's worth now |
| 2 Jun 2025 | £140,000 |
| 1 Dec 2020 | £115,000 |
95, Sydney Grove, Sunholme Estate, Wallsend NE28 9HE
| Today | See what it's worth now |
| 2 Jun 2025 | £96,000 |
| 2 Apr 2015 | £77,000 |
No other historical records.
78, Canterbury Avenue, Hadrian Park, Wallsend NE28 9QG

| Today | See what it's worth now |
| 30 May 2025 | £159,950 |
| 5 Jul 2021 | £134,950 |
7, The Crescent, Wallsend NE28 7RE
| Today | See what it's worth now |
| 30 May 2025 | £237,000 |
| 26 Aug 2021 | £198,000 |
35, Rowantree Road, Newcastle Upon Tyne NE6 4TD
| Today | See what it's worth now |
| 23 May 2025 | £210,000 |
| 6 Jul 2007 | £161,000 |
No other historical records.
7, Oxen Close, Wallsend NE28 9FT
| Today | See what it's worth now |
| 23 May 2025 | £205,000 |
| 27 Nov 2020 | £184,950 |
No other historical records.
3, Fitzsimmons Avenue, Wallsend NE28 8HL
| Today | See what it's worth now |
| 23 May 2025 | £163,000 |
| 26 May 2017 | £109,000 |
No other historical records.
43, Tumulus Avenue, Newcastle Upon Tyne NE6 4XA
| Today | See what it's worth now |
| 23 May 2025 | £126,500 |
| 1 Jun 2018 | £67,000 |
No other historical records.
6, Augusta Court, Hadrian Park, Wallsend NE28 9QZ
| Today | See what it's worth now |
| 23 May 2025 | £110,000 |
| 21 Oct 2002 | £55,000 |
85, Sunholme Drive, Hadrian Lodge East, Wallsend NE28 9YW
| Today | See what it's worth now |
| 21 May 2025 | £94,000 |
| 6 Jul 2007 | £92,500 |
8, Chestnut Street, Wallsend NE28 6TJ
| Today | See what it's worth now |
| 20 May 2025 | £90,500 |
| 5 Nov 2004 | £90,000 |
No other historical records.
26, Radnor Gardens, Howdon, Wallsend NE28 0BY
| Today | See what it's worth now |
| 19 May 2025 | £141,000 |
| 18 Jan 2012 | £85,000 |
No other historical records.
282 Rostrevor, Churchill Street, Wallsend NE28 7TL
| Today | See what it's worth now |
| 19 May 2025 | £175,000 |
| 19 Aug 2005 | £111,000 |
No other historical records.
50, West Street, Wallsend NE28 8LD
| Today | See what it's worth now |
| 19 May 2025 | £203,000 |
| 29 May 2020 | £165,000 |
23, Belmont Close, Battle Hill, Wallsend NE28 9DX

| Today | See what it's worth now |
| 19 May 2025 | £130,000 |
| 28 Feb 2024 | £120,000 |
No other historical records.
Get ready with a Mortgage in Principle
- Personalised result in just 20 minutes
- Find out how much you can borrow
- Get viewings faster with agents
- No impact on your credit score
What's your property worth?
Source Acknowledgement: © Crown copyright. England and Wales house price data is publicly available information produced by the HM Land Registry.This material was last updated on 6 August 2025. It covers the period from 1 January 1995 to 30 June 2025 and contains property transactions which have been registered during that period. Contains HM Land Registry data © Crown copyright and database right 2025. This data is licensed under the Open Government Licence v3.0.
Disclaimer: Rightmove.co.uk provides this HM Land Registry data "as is". The burden for fitness of the data relies completely with the user and is provided for informational purposes only. No warranty, express or implied, is given relating to the accuracy of content of the HM Land Registry data and Rightmove does not accept any liability for error or omission. If you have found an error with the data or need further information please contact HM Land Registry.
Permitted Use: Viewers of this Information are granted permission to access this Crown copyright material and to download it onto electronic, magnetic, optical or similar storage media provided that such activities are for private research, study or in-house use only. Any other use of the material requires the formal written permission of Land Registry which can be requested from us, and is subject to an additional licence and associated charge.
Map data ©OpenStreetMap contributors.
Rightmove takes no liability for your use of, or reliance on, Rightmove's Instant Valuation due to the limitations of our tracking tool listed here. Use of this tool is taken entirely at your own risk. All rights reserved.