
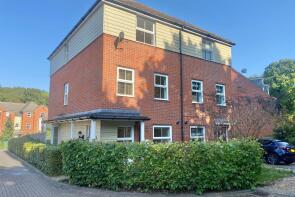
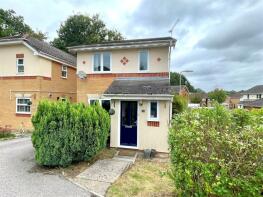
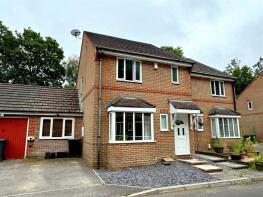
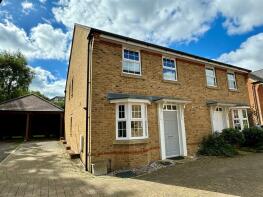
House Prices in Whiteley
House prices in Whiteley have an overall average of £358,277 over the last year.
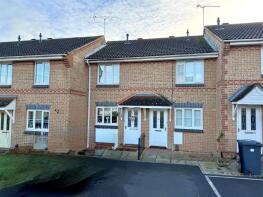
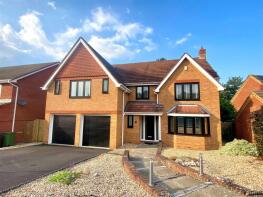
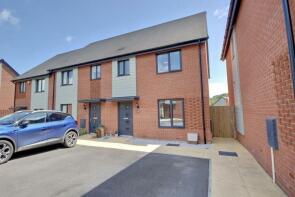
The majority of properties sold in Whiteley during the last year were terraced properties, selling for an average price of £308,272. Detached properties sold for an average of £513,352, with semi-detached properties fetching £356,216.
Overall, the historical sold prices in Whiteley over the last year were 14% down on the previous year and 10% down on the 2022 peak of £398,911.
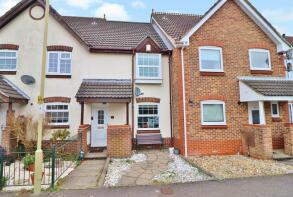
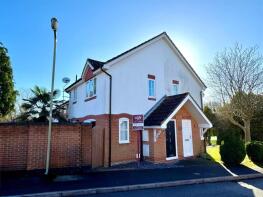
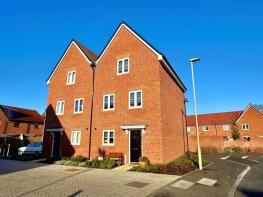
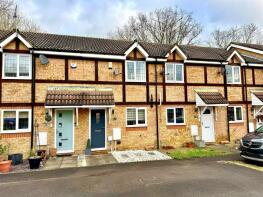
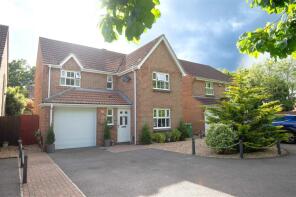
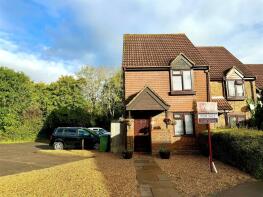
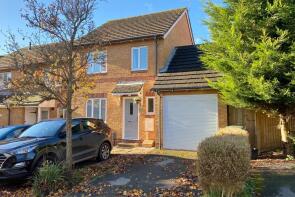
Properties Sold
21, Clydesdale Road, Whiteley, Fareham PO15 7BD
| Today | See what it's worth now |
| 13 Jun 2025 | £270,000 |
| 17 May 2019 | £234,500 |
40, Suffolk Drive, Whiteley, Fareham PO15 7DH
| Today | See what it's worth now |
| 2 Jun 2025 | £237,500 |
| 25 Oct 2021 | £200,000 |
14, Willowherb Road, Curbridge SO30 2HQ
| Today | See what it's worth now |
| 30 May 2025 | £375,000 |
| 14 Sep 2024 | £370,000 |
No other historical records.
24, Andalusian Gardens, Whiteley, Fareham PO15 7DU
| Today | See what it's worth now |
| 30 May 2025 | £281,000 |
| 24 Sep 2021 | £250,000 |
61, Thyme Avenue, Fareham PO15 7GJ
| Today | See what it's worth now |
| 29 May 2025 | £290,000 |
| 8 Nov 2023 | £259,500 |
17, Jutland Close, Whiteley, Fareham PO15 7DQ
| Today | See what it's worth now |
| 19 May 2025 | £262,500 |
| 19 May 2017 | £210,000 |
4, Chesterton Place, Whiteley, Fareham PO15 7EZ
| Today | See what it's worth now |
| 16 May 2025 | £335,000 |
| 11 Aug 2006 | £181,950 |
2, Kingswood Court, Kingswood Close, Fareham PO15 7GD
| Today | See what it's worth now |
| 14 May 2025 | £156,100 |
| 26 Jun 2015 | £163,500 |
9, Defoe Close, Whiteley, Fareham PO15 7JF
| Today | See what it's worth now |
| 13 May 2025 | �£420,000 |
| 14 Oct 2011 | £240,000 |
7, Hanoverian Way, Whiteley, Fareham PO15 7JT
| Today | See what it's worth now |
| 30 Apr 2025 | £755,000 |
| 16 Jul 2004 | £362,500 |
35, Castilian Way, Whiteley, Fareham PO15 7NR
| Today | See what it's worth now |
| 28 Apr 2025 | £205,000 |
| 10 Jun 2015 | £172,000 |
114, Thyme Avenue, Fareham PO15 7GF
| Today | See what it's worth now |
| 11 Apr 2025 | £558,750 |
| 20 Oct 2017 | £465,000 |
12, Castilian Way, Whiteley, Fareham PO15 7NR
| Today | See what it's worth now |
| 10 Apr 2025 | £381,180 |
| 10 Dec 2010 | £218,178 |
No other historical records.
27, Rattigan Gardens, Whiteley, Fareham PO15 7EA
| Today | See what it's worth now |
| 7 Apr 2025 | £310,000 |
| 10 Feb 2014 | £216,000 |
2, Hyssop Close, Fareham PO15 7JS
| Today | See what it's worth now |
| 31 Mar 2025 | £365,000 |
| 15 Apr 2011 | £193,000 |
5, Whiteley Local Centre, Gull Coppice, Whiteley, Fareham PO15 7LS

| Today | See what it's worth now |
| 28 Mar 2025 | £189,950 |
| 21 Jul 2006 | £125,000 |
No other historical records.
10, Danube Drive, Swanwick, Southampton SO31 1ER
| Today | See what it's worth now |
| 28 Mar 2025 | £380,000 |
| 12 May 2016 | £315,000 |
20, Lovage Road, Fareham PO15 7LD
| Today | See what it's worth now |
| 28 Mar 2025 | £240,000 |
| 27 Nov 2006 | £110,000 |
7, Arbour Court, Fareham PO15 7FG
| Today | See what it's worth now |
| 28 Mar 2025 | £186,000 |
| 17 Jun 2013 | £138,700 |
5, Johnson View, Fareham PO15 7JR
| Today | See what it's worth now |
| 27 Mar 2025 | £690,000 |
| 13 Jan 2021 | £610,000 |
39, Brunel Way, Fareham PO15 7PW
| Today | See what it's worth now |
| 27 Mar 2025 | £373,000 |
| 28 Oct 2021 | £350,000 |
No other historical records.
18, Saffron Way, Fareham PO15 7LQ
| Today | See what it's worth now |
| 27 Mar 2025 | £500,000 |
| 16 May 2011 | £248,000 |
1, Suffolk Drive, Whiteley, Fareham PO15 7DE
| Today | See what it's worth now |
| 27 Mar 2025 | £293,000 |
| 1 Mar 2023 | £249,000 |
26, Angelica Way, Fareham PO15 7HY
| Today | See what it's worth now |
| 24 Mar 2025 | £335,000 |
| 14 Jul 2017 | £275,000 |
15, Chesterton Place, Whiteley, Fareham PO15 7EZ


| Today | See what it's worth now |
| 24 Mar 2025 | £315,000 |
| 27 Mar 2024 | £300,000 |
Get ready with a Mortgage in Principle
- Personalised result in just 20 minutes
- Find out how much you can borrow
- Get viewings faster with agents
- No impact on your credit score
What's your property worth?
Source Acknowledgement: © Crown copyright. England and Wales house price data is publicly available information produced by the HM Land Registry.This material was last updated on 6 August 2025. It covers the period from 1 January 1995 to 30 June 2025 and contains property transactions which have been registered during that period. Contains HM Land Registry data © Crown copyright and database right 2025. This data is licensed under the Open Government Licence v3.0.
Disclaimer: Rightmove.co.uk provides this HM Land Registry data "as is". The burden for fitness of the data relies completely with the user and is provided for informational purposes only. No warranty, express or implied, is given relating to the accuracy of content of the HM Land Registry data and Rightmove does not accept any liability for error or omission. If you have found an error with the data or need further information please contact HM Land Registry.
Permitted Use: Viewers of this Information are granted permission to access this Crown copyright material and to download it onto electronic, magnetic, optical or similar storage media provided that such activities are for private research, study or in-house use only. Any other use of the material requires the formal written permission of Land Registry which can be requested from us, and is subject to an additional licence and associated charge.
Map data ©OpenStreetMap contributors.
Rightmove takes no liability for your use of, or reliance on, Rightmove's Instant Valuation due to the limitations of our tracking tool listed here. Use of this tool is taken entirely at your own risk. All rights reserved.