
House Prices in Woodham
House prices in Woodham have an overall average of £704,325 over the last year.
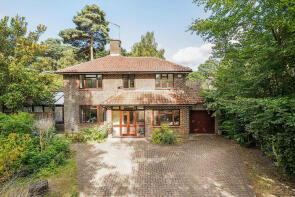
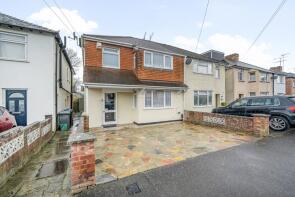
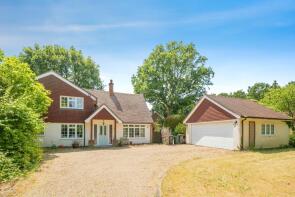
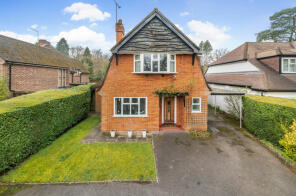
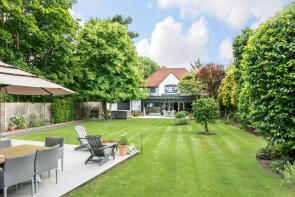
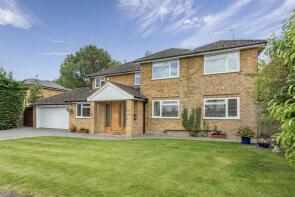
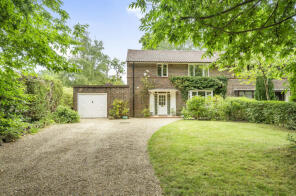
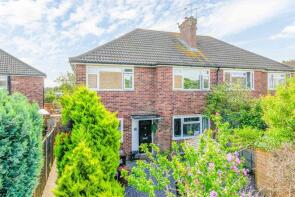
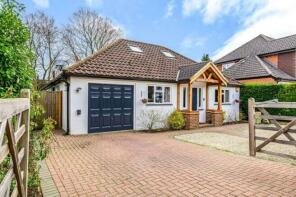
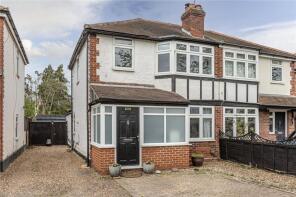
The majority of properties sold in Woodham during the last year were detached properties, selling for an average price of £957,300. Semi-detached properties sold for an average of £504,500, with flats fetching £269,375.
Overall, the historical sold prices in Woodham over the last year were 3% down on the previous year and 2% up on the 2022 peak of £693,843.
Properties Sold
9, Paxton Gardens, Woodham, Woking GU21 5TR
| Today | See what it's worth now |
| 3 Jun 2025 | £840,000 |
| 20 Nov 2020 | £750,000 |
44, Kings Road, Addlestone KT15 3BQ
| Today | See what it's worth now |
| 29 May 2025 | £600,000 |
| 6 May 2021 | £500,000 |
Highleas, Cresta Drive, Addlestone KT15 3SW
| Today | See what it's worth now |
| 28 May 2025 | £920,000 |
| 6 Aug 2014 | £793,500 |
6, The Riding, Woodham, Woking GU21 5TA
| Today | See what it's worth now |
| 24 Apr 2025 | £970,000 |
No other historical records.
367, Woodham Lane, Addlestone KT15 3PW
| Today | See what it's worth now |
| 3 Apr 2025 | £250,000 |
| 19 Dec 2006 | £249,600 |
9c, Acacia Drive, Addlestone KT15 3SH
| Today | See what it's worth now |
| 28 Mar 2025 | £726,000 |
| 17 Aug 2005 | £390,000 |
No other historical records.
393, Woodham Lane, Woodham, Addlestone KT15 3PP
| Today | See what it's worth now |
| 28 Mar 2025 | £670,000 |
No other historical records.
Fariswood, Sheerwater Avenue, Addlestone KT15 3DR
| Today | See what it's worth now |
| 24 Mar 2025 | £1,200,000 |
| 7 Feb 2014 | £830,000 |
No other historical records.
4, Silver Birch Close, Woodham, Addlestone KT15 3QW
| Today | See what it's worth now |
| 14 Mar 2025 | £847,500 |
| 22 Oct 2007 | £499,950 |
31, Amis Avenue, Addlestone KT15 3ET
| Today | See what it's worth now |
| 14 Mar 2025 | £430,000 |
| 10 Jan 2017 | £375,000 |
Orchard House, Cresta Drive, Woodham KT15 3SW
| Today | See what it's worth now |
| 6 Mar 2025 | £660,000 |
No other historical records.
17, Junewood Close, Woodham KT15 3PX
| Today | See what it's worth now |
| 3 Mar 2025 | £725,000 |
No other historical records.
561 Broadfern, Woodham Lane, Woking GU21 5SH
| Today | See what it's worth now |
| 28 Feb 2025 | £1,047,000 |
| 31 Oct 2000 | £382,500 |
15, Lynwood Close, Woodham, Woking GU21 5TJ


| Today | See what it's worth now |
| 26 Feb 2025 | £965,000 |
| 24 Sep 2002 | £415,000 |
No other historical records.
1, Shuna, Woodham Lane, Addlestone KT15 3QR
| Today | See what it's worth now |
| 7 Feb 2025 | £295,000 |
| 26 Jun 2003 | £249,500 |
26, Holly Avenue, New Haw KT15 3UB
| Today | See what it's worth now |
| 3 Feb 2025 | £542,500 |
No other historical records.
26, Manor Drive, Addlestone KT15 3RJ
| Today | See what it's worth now |
| 31 Jan 2025 | £537,000 |
| 10 Sep 2020 | £455,000 |
Callings, Oak End Way, Addlestone KT15 3DU
| Today | See what it's worth now |
| 31 Jan 2025 | £1,607,500 |
| 31 Mar 2017 | £1,120,000 |
6, Homefield Close, Woodham KT15 3QH
| Today | See what it's worth now |
| 31 Jan 2025 | £1,170,000 |
No other historical records.
33, Paxton Gardens, Woodham, Woking GU21 5TS
| Today | See what it's worth now |
| 10 Jan 2025 | £780,000 |
| 12 Oct 2005 | £355,000 |
No other historical records.
88, Copthall Way, Addlestone KT15 3TU
| Today | See what it's worth now |
| 6 Jan 2025 | £307,500 |
| 22 Dec 2011 | £195,000 |
21, Orchard Avenue, Addlestone KT15 3EA
| Today | See what it's worth now |
| 3 Jan 2025 | £865,000 |
| 29 Apr 2015 | £565,000 |
No other historical records.
236, Woodham Lane, Addlestone KT15 3NS
| Today | See what it's worth now |
| 18 Dec 2024 | £490,000 |
| 22 May 2006 | £222,000 |
No other historical records.
76, Scotland Bridge Road, New Haw, Addlestone KT15 3HQ

| Today | See what it's worth now |
| 17 Dec 2024 | £417,000 |
No other historical records.
53, King Georges Drive, Addlestone KT15 3RN

| Today | See what it's worth now |
| 17 Dec 2024 | £520,000 |
| 14 Feb 1997 | £81,200 |
No other historical records.
Get ready with a Mortgage in Principle
- Personalised result in just 20 minutes
- Find out how much you can borrow
- Get viewings faster with agents
- No impact on your credit score
What's your property worth?
Source Acknowledgement: © Crown copyright. England and Wales house price data is publicly available information produced by the HM Land Registry.This material was last updated on 6 August 2025. It covers the period from 1 January 1995 to 30 June 2025 and contains property transactions which have been registered during that period. Contains HM Land Registry data © Crown copyright and database right 2025. This data is licensed under the Open Government Licence v3.0.
Disclaimer: Rightmove.co.uk provides this HM Land Registry data "as is". The burden for fitness of the data relies completely with the user and is provided for informational purposes only. No warranty, express or implied, is given relating to the accuracy of content of the HM Land Registry data and Rightmove does not accept any liability for error or omission. If you have found an error with the data or need further information please contact HM Land Registry.
Permitted Use: Viewers of this Information are granted permission to access this Crown copyright material and to download it onto electronic, magnetic, optical or similar storage media provided that such activities are for private research, study or in-house use only. Any other use of the material requires the formal written permission of Land Registry which can be requested from us, and is subject to an additional licence and associated charge.
Map data ©OpenStreetMap contributors.
Rightmove takes no liability for your use of, or reliance on, Rightmove's Instant Valuation due to the limitations of our tracking tool listed here. Use of this tool is taken entirely at your own risk. All rights reserved.