
House Prices in Yr Wyddgrug
House prices in Yr Wyddgrug have an overall average of £248,614 over the last year.
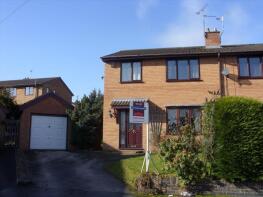
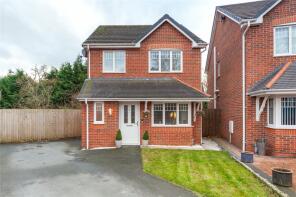
The majority of properties sold in Yr Wyddgrug during the last year were detached properties, selling for an average price of £333,164. Semi-detached properties sold for an average of £201,713, with terraced properties fetching £169,791.
Overall, the historical sold prices in Yr Wyddgrug over the last year were 6% up on the previous year and similar to the 2022 peak of £248,949.
Properties Sold
3, Ash View, A494 Pinfold Lane To Alltami Lgts, Mold CH7 6RN
| Today | See what it's worth now |
| 26 Jun 2025 | £187,500 |
| 1 Aug 2014 | £122,000 |
41, Queens Park, Mold CH7 1TG

| Today | See what it's worth now |
| 20 Jun 2025 | £142,500 |
| 22 Nov 2019 | £115,000 |
No other historical records.
Flat 1, 9 Gordon Terrace, King Street, Mold CH7 1LD


| Today | See what it's worth now |
| 18 Jun 2025 | £120,000 |
| 2 May 2007 | £125,000 |
No other historical records.
30, Langford Crescent, Buckley CH7 2PR
| Today | See what it's worth now |
| 16 Jun 2025 | £232,000 |
| 29 May 2020 | £156,500 |
No other historical records.
5, Muirfield Road, Buckley CH7 2NN
| Today | See what it's worth now |
| 12 Jun 2025 | £270,000 |
| 10 May 2024 | £152,500 |
Wych Elm, Cefn Bychan Road, Mold CH7 5EL
| Today | See what it's worth now |
| 10 Jun 2025 | £505,000 |
| 21 Aug 2017 | £380,000 |
1a, Erw Goed, Mold CH7 6YE
| Today | See what it's worth now |
| 10 Jun 2025 | £300,000 |
| 16 Aug 2002 | £125,000 |
No other historical records.
49, Bryn Mawr, Buckley CH7 2DY
| Today | See what it's worth now |
| 9 Jun 2025 | £165,001 |
| 11 Mar 2022 | £130,000 |
Penrhyn, Black Brook, Mold CH7 6LT
| Today | See what it's worth now |
| 6 Jun 2025 | £882,500 |
| 7 Aug 2019 | £315,000 |
No other historical records.
1, Cranfield Court, New Brighton CH7 6GW
| Today | See what it's worth now |
| 6 Jun 2025 | £558,000 |
No other historical records.
48, Parc Hendy, Mold CH7 1TT
| Today | See what it's worth now |
| 6 Jun 2025 | £196,000 |
| 14 Oct 2016 | £92,000 |
No other historical records.
Minafon, High Street, Mold CH7 6BQ

| Today | See what it's worth now |
| 6 Jun 2025 | £465,000 |
| 14 Nov 2008 | £280,000 |
23, Cedar Grove, Mold CH7 1TE
| Today | See what it's worth now |
| 6 Jun 2025 | £150,000 |
| 9 Jan 1998 | £38,750 |
No other historical records.
9, Ffordd Ganol, Mold CH7 6DZ
| Today | See what it's worth now |
| 4 Jun 2025 | £247,000 |
| 2 Jul 2014 | £147,500 |
No other historical records.
1, Garmon Villas, Gwernaffield Road, Mold CH7 1RN
| Today | See what it's worth now |
| 27 May 2025 | £300,000 |
No other historical records.
24, Parc Hendy, Mold CH7 1TH
| Today | See what it's worth now |
| 23 May 2025 | £215,000 |
| 19 Aug 2005 | �£112,631 |
11, Clwyd Grove, Buckley CH7 2LG
| Today | See what it's worth now |
| 23 May 2025 | £150,000 |
| 5 Dec 2003 | £86,250 |
No other historical records.
1, Henblas Cottage, Ddol Bach Junction To Cae Glas A541, Mold CH7 5UR
| Today | See what it's worth now |
| 22 May 2025 | £335,000 |
| 19 Dec 2018 | £220,000 |
17, Windmill Close, Buckley CH7 3HU
| Today | See what it's worth now |
| 21 May 2025 | £198,000 |
| 10 Aug 2020 | £127,500 |
No other historical records.
Ashbury, Chester Road, Mold CH7 1UE
| Today | See what it's worth now |
| 21 May 2025 | £139,000 |
| 2 May 2003 | £91,000 |
No other historical records.
30, Westbourne Crescent, Buckley CH7 2LD
| Today | See what it's worth now |
| 20 May 2025 | £183,000 |
| 9 Jun 2023 | £176,500 |
11, Eaton Place, Pontybodkin Hill, Mold CH7 4RB
| Today | See what it's worth now |
| 16 May 2025 | £105,000 |
| 15 Jun 2022 | £93,000 |
12, Wylfa Avenue, Mold CH7 6YH
| Today | See what it's worth now |
| 16 May 2025 | £250,000 |
| 13 Jun 2012 | £158,000 |
No other historical records.
11, Llys Menden, Mold CH7 1GF
| Today | See what it's worth now |
| 16 May 2025 | £195,000 |
| 29 Aug 2002 | £84,500 |
9, Oakfield Close, Mold CH7 6WE
| Today | See what it's worth now |
| 16 May 2025 | £280,000 |
| 10 Feb 2017 | £215,000 |
No other historical records.
Get ready with a Mortgage in Principle
- Personalised result in just 20 minutes
- Find out how much you can borrow
- Get viewings faster with agents
- No impact on your credit score
What's your property worth?
Source Acknowledgement: © Crown copyright. England and Wales house price data is publicly available information produced by the HM Land Registry.This material was last updated on 6 August 2025. It covers the period from 1 January 1995 to 30 June 2025 and contains property transactions which have been registered during that period. Contains HM Land Registry data © Crown copyright and database right 2025. This data is licensed under the Open Government Licence v3.0.
Disclaimer: Rightmove.co.uk provides this HM Land Registry data "as is". The burden for fitness of the data relies completely with the user and is provided for informational purposes only. No warranty, express or implied, is given relating to the accuracy of content of the HM Land Registry data and Rightmove does not accept any liability for error or omission. If you have found an error with the data or need further information please contact HM Land Registry.
Permitted Use: Viewers of this Information are granted permission to access this Crown copyright material and to download it onto electronic, magnetic, optical or similar storage media provided that such activities are for private research, study or in-house use only. Any other use of the material requires the formal written permission of Land Registry which can be requested from us, and is subject to an additional licence and associated charge.
Map data ©OpenStreetMap contributors.
Rightmove takes no liability for your use of, or reliance on, Rightmove's Instant Valuation due to the limitations of our tracking tool listed here. Use of this tool is taken entirely at your own risk. All rights reserved.