
House Prices in Hebburn
House prices in Hebburn have an overall average of £177,959 over the last year.
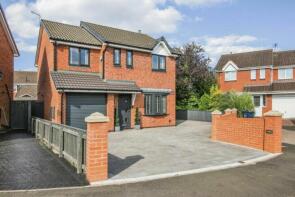
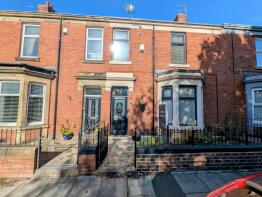
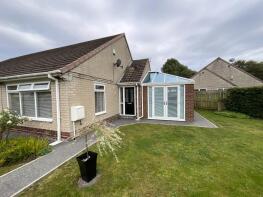
The majority of properties sold in Hebburn during the last year were terraced properties, selling for an average price of £139,907. Semi-detached properties sold for an average of £184,545, with detached properties fetching £306,936.
Overall, the historical sold prices in Hebburn over the last year were 2% down on the previous year and 1% down on the 2022 peak of £180,530.
Properties Sold
36, Makendon Street, Hebburn NE31 1RF
| Today | See what it's worth now |
| 14 Apr 2025 | £145,000 |
| 1 Nov 2019 | £103,000 |
9, Ebba Point, Hebburn NE31 2GF
| Today | See what it's worth now |
| 31 Mar 2025 | £340,000 |
| 29 Apr 2016 | £245,000 |
No other historical records.
18, Penrose Place, Hebburn NE31 2AY
| Today | See what it's worth now |
| 31 Mar 2025 | £160,000 |
| 13 Dec 2016 | £134,995 |
No other historical records.
2, Swallow Drive, Hebburn NE31 1AE
| Today | See what it's worth now |
| 31 Mar 2025 | £398,000 |
| 24 Feb 2021 | £360,000 |
No other historical records.
95, Agincourt, Hebburn NE31 1AW
| Today | See what it's worth now |
| 31 Mar 2025 | £127,500 |
| 22 Jun 2004 | £94,500 |
57, Glenmoor, Hebburn NE31 1DE
| Today | See what it's worth now |
| 31 Mar 2025 | £155,000 |
| 15 Nov 2005 | £99,200 |
No other historical records.
14, Vimy Avenue, Hebburn NE31 1QR
| Today | See what it's worth now |
| 28 Mar 2025 | £53,500 |
| 16 Apr 2010 | £60,000 |
39, Clyde Avenue, Hebburn NE31 2JW
| Today | See what it's worth now |
| 28 Mar 2025 | £109,500 |
| 16 Mar 2007 | �£71,000 |
No other historical records.
83, Sullivan Walk, Hebburn NE31 1YW
| Today | See what it's worth now |
| 28 Mar 2025 | £165,000 |
| 1 May 2009 | £225,000 |
224, St Aloysius View, Hebburn NE31 1TJ
| Today | See what it's worth now |
| 28 Mar 2025 | £222,000 |
| 30 Jun 2014 | £154,950 |
No other historical records.
73, Holmes Drive, Hebburn NE31 2BE

| Today | See what it's worth now |
| 28 Mar 2025 | £405,000 |
| 20 Dec 2018 | £332,995 |
No other historical records.
40, Hexham Avenue, Hebburn NE31 2JG


| Today | See what it's worth now |
| 26 Mar 2025 | £170,000 |
No other historical records.
4, Somerset Road, Hebburn NE31 2DS

| Today | See what it's worth now |
| 25 Mar 2025 | £145,000 |
| 23 Jul 2021 | £120,000 |
7, St Annes Close, Hebburn NE31 1TL
| Today | See what it's worth now |
| 25 Mar 2025 | £205,000 |
| 30 Jun 2016 | £155,950 |
No other historical records.
111, St Aloysius View, Hebburn NE31 1RH
| Today | See what it's worth now |
| 25 Mar 2025 | £250,000 |
| 1 Sep 2023 | £240,000 |
75, Victoria Road West, Hebburn NE31 1UY
| Today | See what it's worth now |
| 25 Mar 2025 | £125,000 |
| 28 Feb 2020 | £98,000 |
No other historical records.
33, Robin Close, Hebburn NE31 1AJ

| Today | See what it's worth now |
| 24 Mar 2025 | £301,625 |
No other historical records.
19, Triumph Drive, Hebburn NE31 1FB
| Today | See what it's worth now |
| 21 Mar 2025 | £163,500 |
| 20 May 2022 | £152,000 |
16, Suffolk Road, Hebburn NE31 2DX
| Today | See what it's worth now |
| 20 Mar 2025 | £55,000 |
| 29 Sep 2017 | £75,607 |
16, The Riverside, Hebburn NE31 1BG
| Today | See what it's worth now |
| 17 Mar 2025 | £420,000 |
| 28 Feb 2005 | £249,999 |
31, Woodvale Drive, Hebburn NE31 1RA
| Today | See what it's worth now |
| 17 Mar 2025 | £315,000 |
| 6 May 2016 | £165,000 |
No other historical records.
2, St Michaels Vale, Hebburn NE31 1RL

| Today | See what it's worth now |
| 14 Mar 2025 | £295,000 |
| 27 Feb 2014 | £165,000 |
27, William Street West, Hebburn NE31 1DQ

| Today | See what it's worth now |
| 14 Mar 2025 | £115,000 |
| 6 Mar 2020 | £70,500 |
No other historical records.
14, Canning Street, Hebburn NE31 2UE
| Today | See what it's worth now |
| 14 Mar 2025 | £200,000 |
| 30 Apr 2021 | £167,500 |
No other historical records.
26, Dahlia Way, Hebburn NE31 2QH
| Today | See what it's worth now |
| 14 Mar 2025 | £180,000 |
| 29 May 2015 | £135,000 |
No other historical records.
Get ready with a Mortgage in Principle
- Personalised result in just 20 minutes
- Find out how much you can borrow
- Get viewings faster with agents
- No impact on your credit score
What's your property worth?
Source Acknowledgement: © Crown copyright. England and Wales house price data is publicly available information produced by the HM Land Registry.This material was last updated on 25 June 2025. It covers the period from 1 January 1995 to 30 April 2025 and contains property transactions which have been registered during that period. Contains HM Land Registry data © Crown copyright and database right 2025. This data is licensed under the Open Government Licence v3.0.
Disclaimer: Rightmove.co.uk provides this HM Land Registry data "as is". The burden for fitness of the data relies completely with the user and is provided for informational purposes only. No warranty, express or implied, is given relating to the accuracy of content of the HM Land Registry data and Rightmove does not accept any liability for error or omission. If you have found an error with the data or need further information please contact HM Land Registry.
Permitted Use: Viewers of this Information are granted permission to access this Crown copyright material and to download it onto electronic, magnetic, optical or similar storage media provided that such activities are for private research, study or in-house use only. Any other use of the material requires the formal written permission of Land Registry which can be requested from us, and is subject to an additional licence and associated charge.
Map data ©OpenStreetMap contributors.
Rightmove takes no liability for your use of, or reliance on, Rightmove's Instant Valuation due to the limitations of our tracking tool listed here. Use of this tool is taken entirely at your own risk. All rights reserved.