
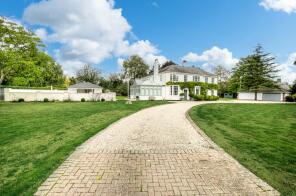
House Prices in Bovinger
House prices in Bovinger have an overall average of £621,019 over the last year.
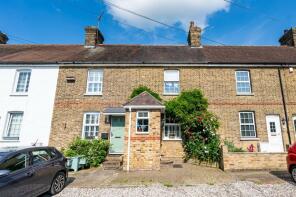
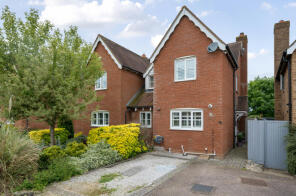
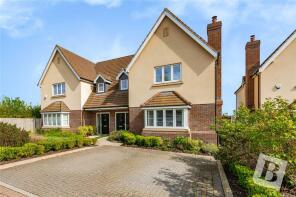
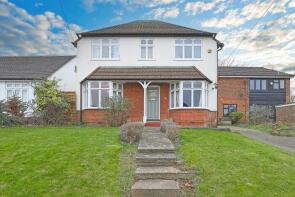
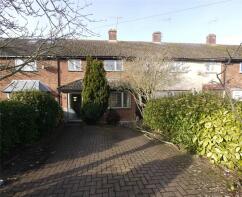
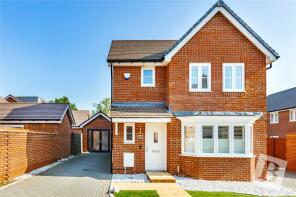
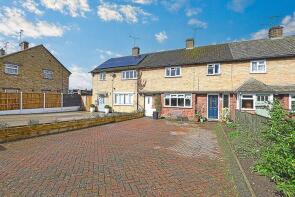
The majority of properties sold in Bovinger during the last year were detached properties, selling for an average price of £864,375. Terraced properties sold for an average of £449,200, with semi-detached properties fetching £497,000.
Overall, the historical sold prices in Bovinger over the last year were 4% up on the previous year and 7% down on the 2020 peak of £665,500.
Properties Sold
Borrowdale, Ongar Road, Fyfield, Ongar CM5 0RD
| Today | See what it's worth now |
| 31 Mar 2025 | £675,000 |
No other historical records.
Little Orchard, Mill Lane, Moreton, Ongar CM5 0DN
| Today | See what it's worth now |
| 24 Mar 2025 | £685,000 |
| 14 Jan 2003 | £430,000 |
50, Cripsey Avenue, Ongar CM5 0AU
| Today | See what it's worth now |
| 20 Mar 2025 | £435,000 |
| 24 May 2022 | £420,000 |
182, Queensway, Ongar CM5 0BS
| Today | See what it's worth now |
| 19 Feb 2025 | £410,000 |
| 19 Aug 2020 | £350,000 |
1, Maltings Farm, Maltings Hill, Moreton, Ongar CM5 0JY
| Today | See what it's worth now |
| 13 Feb 2025 | £715,000 |
| 23 Aug 2024 | £727,000 |
No other historical records.
39, Acres Avenue, Ongar CM5 0BJ
| Today | See what it's worth now |
| 16 Dec 2024 | £420,000 |
| 15 Dec 2003 | £185,750 |
No other historical records.
41, Shortlands Avenue, Ongar CM5 0BL
| Today | See what it's worth now |
| 13 Dec 2024 | £367,500 |
No other historical records.
The Elms, Bassetts Lane, Willingale, Ongar CM5 0QJ

| Today | See what it's worth now |
| 12 Dec 2024 | £960,000 |
| 4 Nov 2014 | £700,000 |
9, Wood Lane, Willingale, Ongar CM5 0QU
| Today | See what it's worth now |
| 29 Nov 2024 | £600,000 |
No other historical records.
Herbert House, Workers Road, High Laver, Ongar CM5 0DZ
| Today | See what it's worth now |
| 28 Nov 2024 | £2,225,000 |
| 17 Sep 2020 | £2,650,000 |
No other historical records.
12, Aukingford Gardens, Ongar CM5 0BG
| Today | See what it's worth now |
| 28 Nov 2024 | £425,000 |
| 18 Jan 2016 | £305,000 |
Mandaley, Epping Road, Bobbingworth, Ongar CM5 0BE

| Today | See what it's worth now |
| 27 Nov 2024 | £302,000 |
No other historical records.
24, Forest Drive, Fyfield, Ongar CM5 0TP
| Today | See what it's worth now |
| 27 Nov 2024 | £550,000 |
| 7 Dec 2018 | £445,000 |
2, Corn Barn Close, Abbess Beauchamp And Berners Roding, Ongar CM5 0FP
| Today | See what it's worth now |
| 22 Nov 2024 | £740,000 |
| 29 Mar 2018 | £650,000 |
No other historical records.
32, Springfield Close, Ongar CM5 0BB
| Today | See what it's worth now |
| 21 Nov 2024 | £495,000 |
No other historical records.
3, Kimpton Close, Ongar CM5 0BQ
| Today | See what it's worth now |
| 8 Nov 2024 | £422,500 |
| 27 Mar 2017 | £350,000 |
No other historical records.
60, Queensway, Ongar CM5 0BN
| Today | See what it's worth now |
| 28 Oct 2024 | £370,000 |
No other historical records.
60, Great Stony Park, High Street, Ongar CM5 0TH
| Today | See what it's worth now |
| 17 Oct 2024 | £724,400 |
| 24 Jul 2003 | £244,000 |
19, Moreton Road, Ongar CM5 0AP
| Today | See what it's worth now |
| 27 Sep 2024 | £550,000 |
| 5 Jan 2007 | £275,000 |
No other historical records.
37, Acres Avenue, Ongar CM5 0BJ
| Today | See what it's worth now |
| 20 Sep 2024 | £360,000 |
| 16 Jun 2008 | £244,000 |
11, Elstar Road, Ongar CM5 0FR
| Today | See what it's worth now |
| 6 Sep 2024 | £610,000 |
| 1 Nov 2019 | £515,000 |
No other historical records.
5, Acres Avenue, Ongar CM5 0BH
| Today | See what it's worth now |
| 16 Aug 2024 | £365,000 |
| 27 Jan 1999 | £75,000 |
No other historical records.
14, Acres Avenue, Ongar CM5 0BH
| Today | See what it's worth now |
| 19 Jul 2024 | £375,000 |
| 11 Jun 2007 | £200,000 |
81, Moreton Road, Ongar CM5 0AR
| Today | See what it's worth now |
| 18 Jul 2024 | £360,000 |
| 20 Oct 2020 | £350,000 |
4, Springfield Close, Ongar CM5 0BB
| Today | See what it's worth now |
| 10 Jul 2024 | £760,000 |
No other historical records.
Get ready with a Mortgage in Principle
- Personalised result in just 20 minutes
- Find out how much you can borrow
- Get viewings faster with agents
- No impact on your credit score
What's your property worth?
Source Acknowledgement: © Crown copyright. England and Wales house price data is publicly available information produced by the HM Land Registry.This material was last updated on 6 August 2025. It covers the period from 1 January 1995 to 30 June 2025 and contains property transactions which have been registered during that period. Contains HM Land Registry data © Crown copyright and database right 2025. This data is licensed under the Open Government Licence v3.0.
Disclaimer: Rightmove.co.uk provides this HM Land Registry data "as is". The burden for fitness of the data relies completely with the user and is provided for informational purposes only. No warranty, express or implied, is given relating to the accuracy of content of the HM Land Registry data and Rightmove does not accept any liability for error or omission. If you have found an error with the data or need further information please contact HM Land Registry.
Permitted Use: Viewers of this Information are granted permission to access this Crown copyright material and to download it onto electronic, magnetic, optical or similar storage media provided that such activities are for private research, study or in-house use only. Any other use of the material requires the formal written permission of Land Registry which can be requested from us, and is subject to an additional licence and associated charge.
Map data ©OpenStreetMap contributors.
Rightmove takes no liability for your use of, or reliance on, Rightmove's Instant Valuation due to the limitations of our tracking tool listed here. Use of this tool is taken entirely at your own risk. All rights reserved.