
House Prices in Guisborough
House prices in Guisborough have an overall average of £218,425 over the last year.
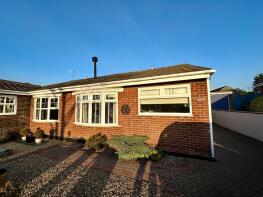
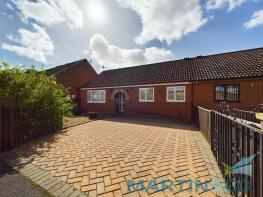
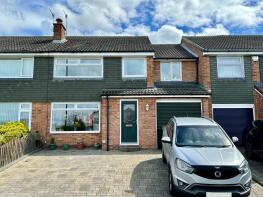
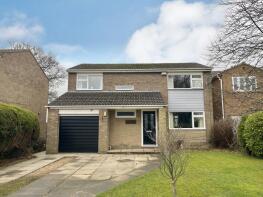
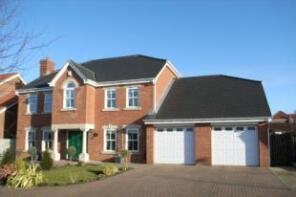
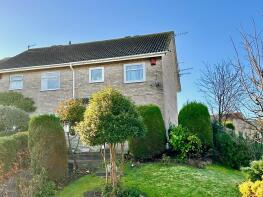
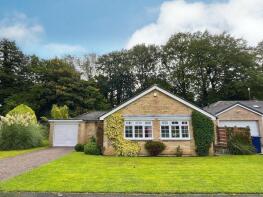
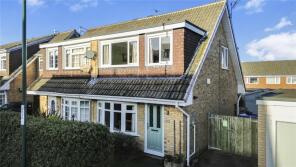
The majority of properties sold in Guisborough during the last year were semi-detached properties, selling for an average price of £196,145. Detached properties sold for an average of £346,045, with terraced properties fetching £123,769.
Overall, the historical sold prices in Guisborough over the last year were 3% up on the previous year and 5% up on the 2021 peak of £207,103.
Properties Sold
29, Whaddon Chase, Guisborough TS14 7NQ
| Today | See what it's worth now |
| 9 Jun 2025 | £200,000 |
| 19 Sep 2014 | £125,000 |
No other historical records.
31, Union Street, Guisborough TS14 6HL


| Today | See what it's worth now |
| 9 Jun 2025 | £125,000 |
| 13 Dec 2019 | £98,000 |
15b, Upper Garth Gardens, Guisborough TS14 6HA
| Today | See what it's worth now |
| 6 Jun 2025 | £187,000 |
| 23 Nov 2022 | £169,950 |
118, Whitby Avenue, Guisborough TS14 7BA
| Today | See what it's worth now |
| 6 Jun 2025 | £210,000 |
| 29 Jun 2012 | £120,000 |
No other historical records.
46, Belmangate, Guisborough TS14 7AB

| Today | See what it's worth now |
| 6 Jun 2025 | £90,000 |
| 27 Apr 2005 | £120,000 |
97, Aldenham Road, Guisborough TS14 8LB
| Today | See what it's worth now |
| 6 Jun 2025 | £358,500 |
| 19 Aug 2011 | £250,000 |
No other historical records.
64, Whitby Avenue, Guisborough TS14 7BA
| Today | See what it's worth now |
| 6 Jun 2025 | £175,000 |
| 17 Nov 2017 | £110,000 |
No other historical records.
28, Hunters Place, Guisborough TS14 7BF

| Today | See what it's worth now |
| 4 Jun 2025 | £130,000 |
| 16 Dec 2016 | £129,950 |
No other historical records.
3, Skye Walk, Guisborough TS14 7ED
| Today | See what it's worth now |
| 30 May 2025 | £148,960 |
No other historical records.
18, Ilkley Grove, Guisborough TS14 8LL
| Today | See what it's worth now |
| 30 May 2025 | £135,000 |
| 12 Oct 2020 | £115,000 |
18, Cringle Gardens, Guisborough TS14 8FA
| Today | See what it's worth now |
| 30 May 2025 | £227,500 |
| 24 Feb 2017 | £173,995 |
No other historical records.
15, Monkton Rise, Guisborough TS14 6GF
| Today | See what it's worth now |
| 30 May 2025 | £640,000 |
| 26 Apr 2010 | £492,500 |
18, Oak Road, Guisborough TS14 6JD

| Today | See what it's worth now |
| 30 May 2025 | £120,000 |
No other historical records.
20, Bilsdale Gardens, Guisborough TS14 8DG

| Today | See what it's worth now |
| 29 May 2025 | £360,000 |
| 18 Apr 2024 | £350,000 |
7, Montagu's Harrier, Guisborough TS14 8PB
| Today | See what it's worth now |
| 29 May 2025 | £177,000 |
| 9 Feb 2024 | £170,000 |
No other historical records.
8, Ryedale, Guisborough TS14 8JE
| Today | See what it's worth now |
| 27 May 2025 | £340,000 |
| 25 May 2001 | £110,000 |
No other historical records.
19, Duhallow Close, Guisborough TS14 7PF
| Today | See what it's worth now |
| 23 May 2025 | £165,000 |
| 21 Feb 2014 | £120,000 |
24, Beaufort Close, Guisborough TS14 7PW
| Today | See what it's worth now |
| 16 May 2025 | £162,500 |
| 20 Jun 2003 | £87,050 |
178, Westgate, Guisborough TS14 6NL
| Today | See what it's worth now |
| 13 May 2025 | £182,500 |
| 14 Sep 2018 | £115,000 |
No other historical records.
22, Maple Gardens, Guisborough TS14 6NY
| Today | See what it's worth now |
| 9 May 2025 | £220,000 |
| 27 Mar 2015 | £159,950 |
No other historical records.
5, Meath Way, Guisborough TS14 7PG
| Today | See what it's worth now |
| 9 May 2025 | £190,000 |
| 5 Dec 2014 | £122,000 |
32, Allison Street, Guisborough TS14 6NX
| Today | See what it's worth now |
| 9 May 2025 | £129,000 |
| 19 Jun 2009 | £110,000 |
43, Fernie Road, Guisborough TS14 7LZ
| Today | See what it's worth now |
| 9 May 2025 | £257,500 |
No other historical records.
59, New Road, Guisborough TS14 6AQ
| Today | See what it's worth now |
| 6 May 2025 | £105,000 |
No other historical records.
26, Eglinton Avenue, Guisborough TS14 7BN
| Today | See what it's worth now |
| 29 Apr 2025 | £126,000 |
| 7 Jun 2019 | £115,000 |
Get ready with a Mortgage in Principle
- Personalised result in just 20 minutes
- Find out how much you can borrow
- Get viewings faster with agents
- No impact on your credit score
What's your property worth?
Source Acknowledgement: © Crown copyright. England and Wales house price data is publicly available information produced by the HM Land Registry.This material was last updated on 6 August 2025. It covers the period from 1 January 1995 to 30 June 2025 and contains property transactions which have been registered during that period. Contains HM Land Registry data © Crown copyright and database right 2025. This data is licensed under the Open Government Licence v3.0.
Disclaimer: Rightmove.co.uk provides this HM Land Registry data "as is". The burden for fitness of the data relies completely with the user and is provided for informational purposes only. No warranty, express or implied, is given relating to the accuracy of content of the HM Land Registry data and Rightmove does not accept any liability for error or omission. If you have found an error with the data or need further information please contact HM Land Registry.
Permitted Use: Viewers of this Information are granted permission to access this Crown copyright material and to download it onto electronic, magnetic, optical or similar storage media provided that such activities are for private research, study or in-house use only. Any other use of the material requires the formal written permission of Land Registry which can be requested from us, and is subject to an additional licence and associated charge.
Map data ©OpenStreetMap contributors.
Rightmove takes no liability for your use of, or reliance on, Rightmove's Instant Valuation due to the limitations of our tracking tool listed here. Use of this tool is taken entirely at your own risk. All rights reserved.